
 1 / 39 photos


About This Property
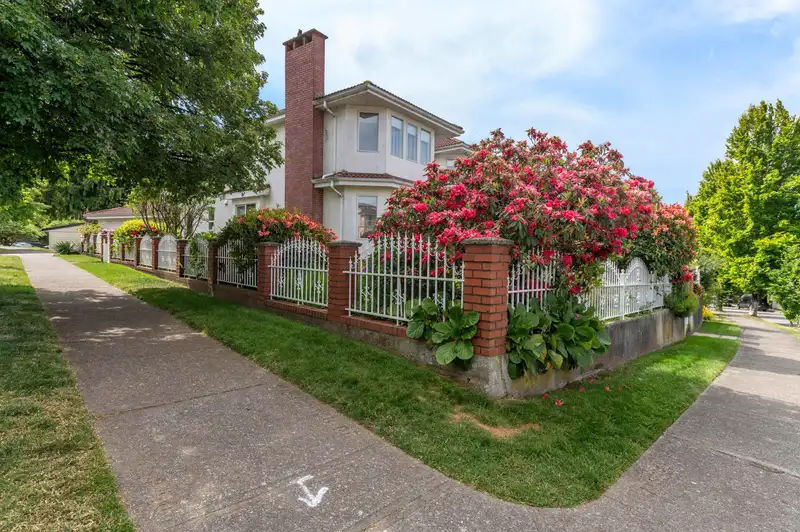
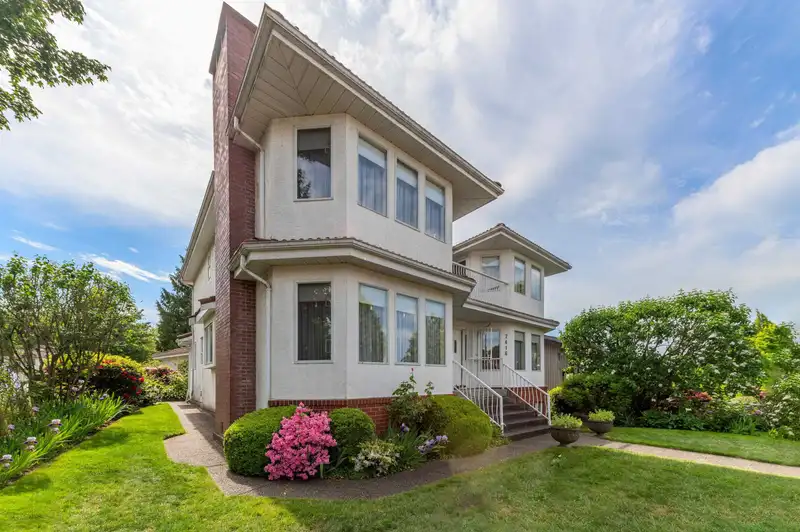
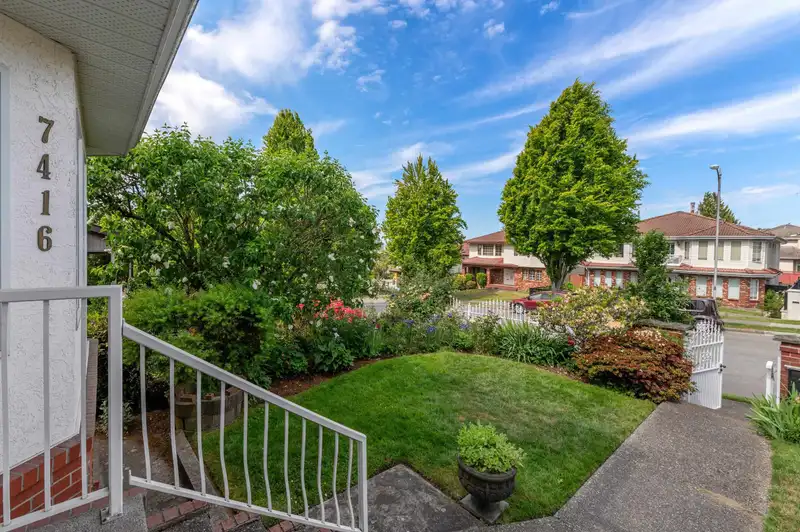
Great 6-7 Bedroom, 5 full Bathroom family home on big 6145 sq.ft. Corner Lot with 3 car garage off laneway. First time on the market, original owners This spotless home has room for large/extended family with manicured, mature flower gardens, vegetable gardens with schools, parks and golf course in the neighbourhood. This property is under the new zoning…
Property Details
School Catchment
Neighbourhood
Age
- Under 1511.5%
- 15 to 6466.9%
- 65 and over21.6%
Household size
- 1 person19.8%
- 229.3%
- 319%
- 416.8%
- 5 or more15%
Language spoken at home
33.6% Cantonese mother tongue
Mother tongue, share of 3,910 residents.
How this pocket differs
- more seniors 65+ than Vancouver East 21.6% vs 17%
- notably more 5+ person households than Vancouver East 15.1% vs 8.7%
- notably fewer people living alone than Vancouver East 19.9% vs 32.3%
- more 4-person households than Vancouver East 16.9% vs 12.7%
- notably more Punjabi speakers than Vancouver East 8.1% vs 3.6%
- notably more Cantonese speakers than Vancouver East 33.6% vs 17.8%
- Median dwelling value is notably higher than Metro Vancouver $2,000,000 vs $1,050,000
Source: Statistics Canada, Census of Population, 2021. Reproduced and distributed on an "as is" basis with the permission of Statistics Canada.
Land & Development
Zoning, lot dimensions and grade are approximate, from public data, and for reference only — verify with the City / Township of Langley before relying on them.
Recent nearby sales
Sold prices are available to registered users. Log in to see what these sold for.
Monthly Cost Calculator
An estimate only. Canadian semi-annual compounding; excludes utilities, closing costs and BC property transfer tax. 5-year fixed, as of Nov 12
Similar Listings Nearby
7689 JASPER CRESCENT
1761 E 57TH AVENUE
7275 VICTORIA DRIVE
1791 E 64TH AVENUE
1631 E 58TH AVENUE
1909 E 64TH AVENUE
1842 E 64TH AVENUE
1685 E 55TH AVENUE
6947 BEATRICE STREET
1841 SE MARINE DRIVE
1563 E 59TH AVENUE
6915 BEATRICE STREET