
 1 / 37 photos













About This Property
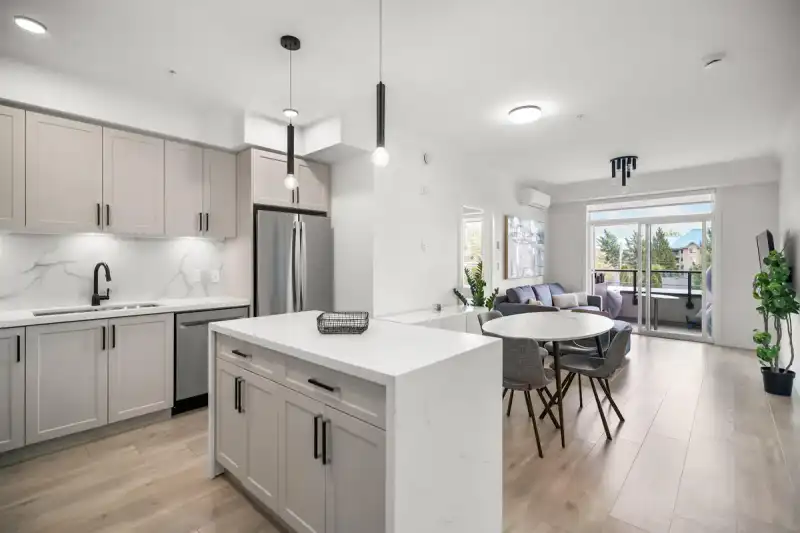
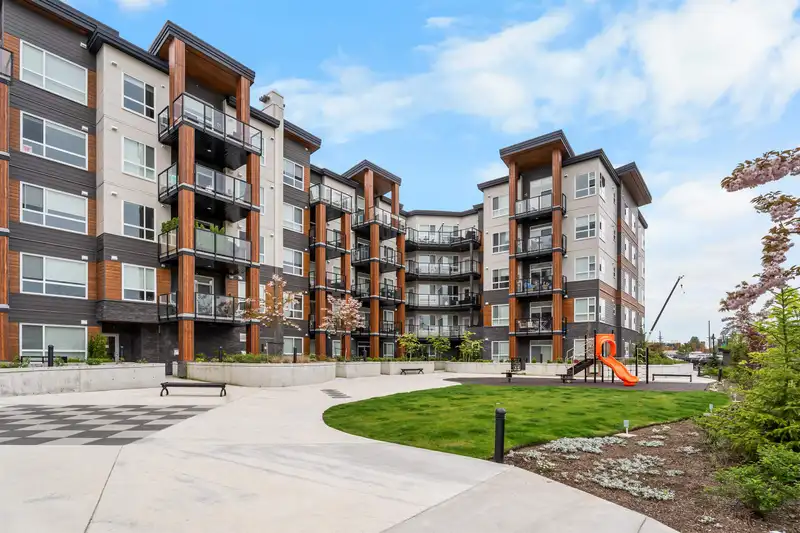
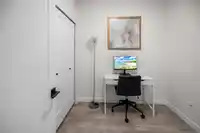
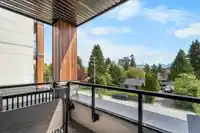
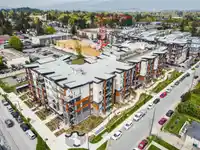
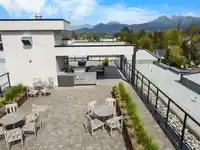
NO GST! Perfect for first-time buyers or investors! Welcome to this like-new 2-bedroom, 2-bath + den home in Maple Ridge, featuring desirable North & East exposure. Built just 1 year ago, this bright home offers a smart layout with bedrooms on opposite sides for privacy. The primary bedroom includes a walk-in closet and ensuite with double sinks. Modern…
Features
Property Details
School Catchment
Neighbourhood
Age
- Under 1512.9%
- 15 to 6462.2%
- 65 and over24.9%
Household size
- 1 person42%
- 233.1%
- 311.6%
- 48.5%
- 5 or more4.8%
Language spoken at home
76.9% English mother tongue
Mother tongue, share of 4,930 residents.
How this pocket differs
- more seniors 65+ than East Central 24.9% vs 20.6%
- notably fewer 5+ person households than East Central 4.8% vs 7.5%
- fewer 4-person households than East Central 8.5% vs 12.3%
- more people living alone than East Central 41.9% vs 32.5%
- Median household income is lower than Metro Vancouver $65,000 vs $90,000
- Median dwelling value is notably lower than Metro Vancouver $512,000 vs $1,050,000
Source: Statistics Canada, Census of Population, 2021. Reproduced and distributed on an "as is" basis with the permission of Statistics Canada.
Sales History
| Date | Sale Price |
|---|---|
| Jan 22, 2024 | $547,995 |
Source: BC Assessment (public records).
Recent nearby sales
Sold prices are available to registered users. Log in to see what these sold for.
Monthly Cost Calculator
An estimate only. Canadian semi-annual compounding; excludes utilities, closing costs and BC property transfer tax. 5-year fixed, as of Nov 2
Similar Listings Nearby
322 12109 223 STREET
430 12109 223 STREET
510 12109 223 STREET
225 12109 223 STREET
421 12143 223 STREET
113 12143 223 STREET
407 12143 223 STREET
321 12143 223 STREET
212 12143 223 STREET
110 12143 223 STREET
412 12143 223 STREET
218 12143 223 STREET