
 1 / 39 photos


About This Property
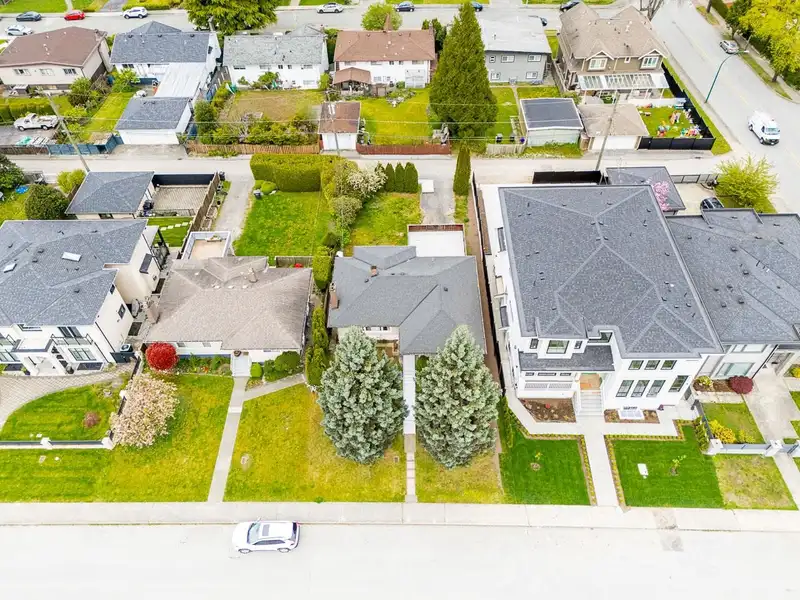
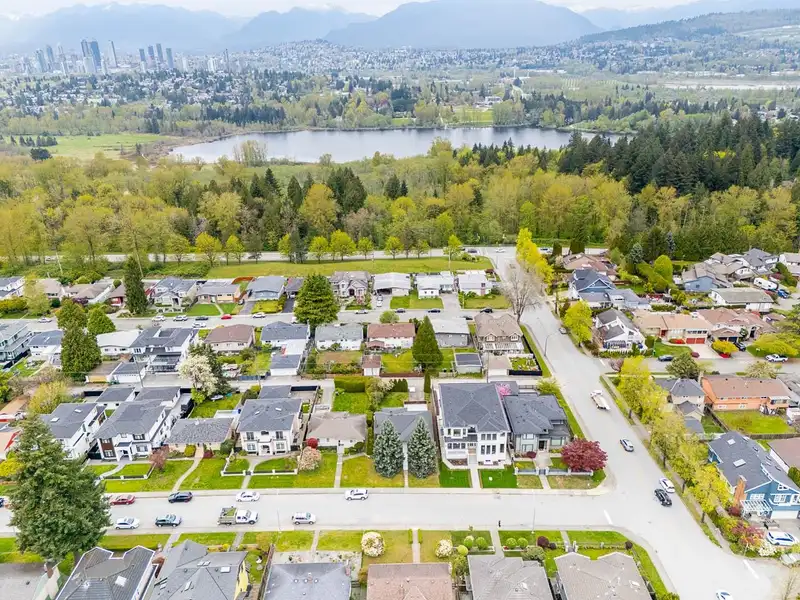
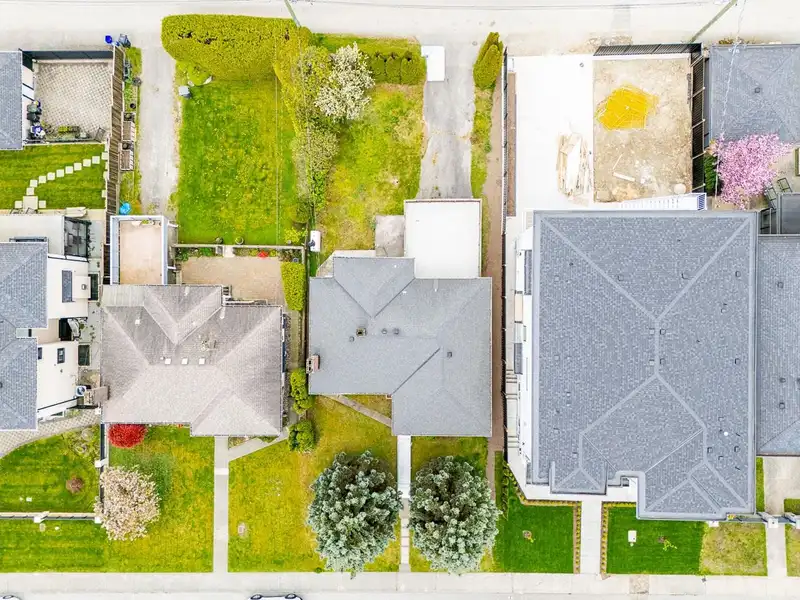
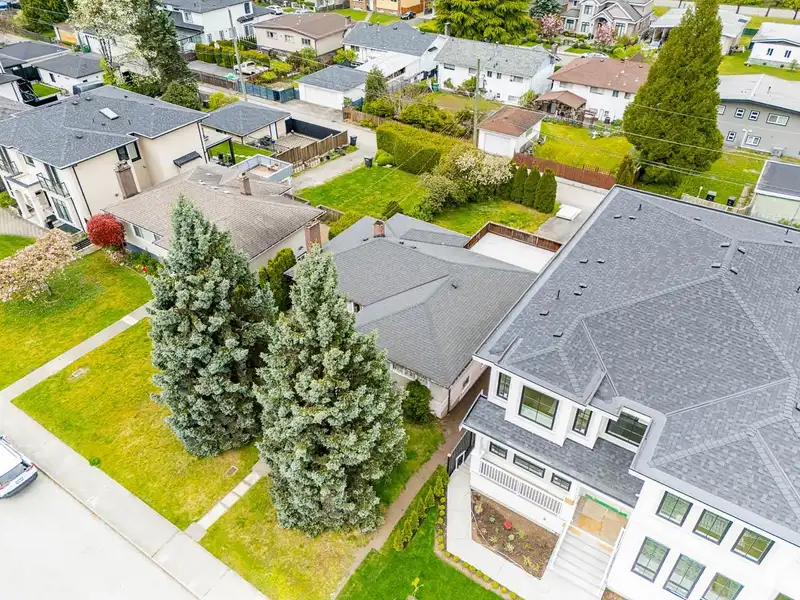
Excellent opportunity to build in a prime Burnaby location! This 53 ft x 125 ft lot (6,648 sq ft) offers flexible development potential. Build up to 4 units, each approximately 1,994 sq ft over 3 levels, or a duplex with up to 3,489 sq ft per side, or 2,829 sq ft per side with single-car garages. Ideal for builders, investors, or end users looking to create…
Features
Property Details
School Catchment
Neighbourhood
Age
- Under 1513.9%
- 15 to 6468.4%
- 65 and over17.7%
Household size
- 1 person15.6%
- 227.1%
- 320.7%
- 419.6%
- 5 or more17%
Language spoken at home
34.3% English mother tongue
Mother tongue, share of 5,845 residents.
How this pocket differs
- notably more 5+ person households than Burnaby South 16.9% vs 7.7%
- notably fewer people living alone than Burnaby South 15.6% vs 30.4%
- notably more 4-person households than Burnaby South 19.6% vs 12.3%
- notably more Punjabi speakers than Burnaby South 3.6% vs 2.3%
- more Mandarin speakers than Burnaby South 21.3% vs 17.4%
- Median dwelling value is notably higher than Metro Vancouver $1,760,000 vs $1,050,000
Source: Statistics Canada, Census of Population, 2021. Reproduced and distributed on an "as is" basis with the permission of Statistics Canada.
Land & Development
Zoning, lot dimensions and grade are approximate, from public data, and for reference only — verify with the City / Township of Langley before relying on them.
Recent nearby sales
Sold prices are available to registered users. Log in to see what these sold for.
Monthly Cost Calculator
An estimate only. Canadian semi-annual compounding; excludes utilities, closing costs and BC property transfer tax. 5-year fixed, as of Nov 12
Similar Listings Nearby
6291 DICKENS STREET
6038 GILLEY AVENUE
6119 SERVICE STREET
6096 SERVICE STREET
6555 ST. CHARLES PLACE
6658 RANDOLPH AVENUE
5891 DICKENS PLACE
5987 BRANTFORD AVENUE
6760 LAKEVIEW AVENUE
5929 IMPERIAL STREET
5885 WALKER AVENUE
6643 IMPERIAL STREET