
 1 / 22 photos


About This Property
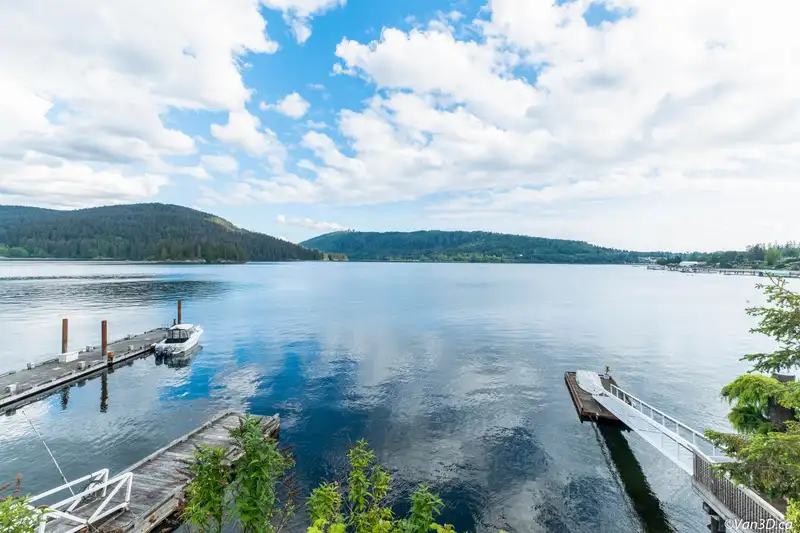
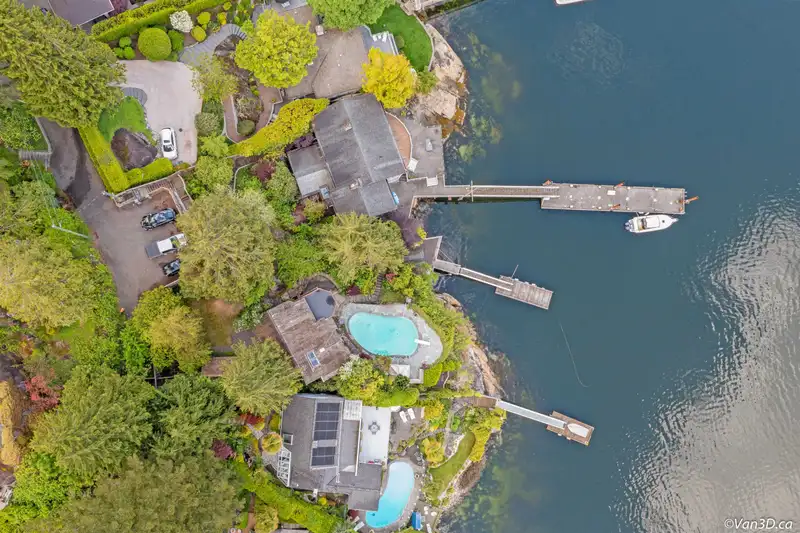
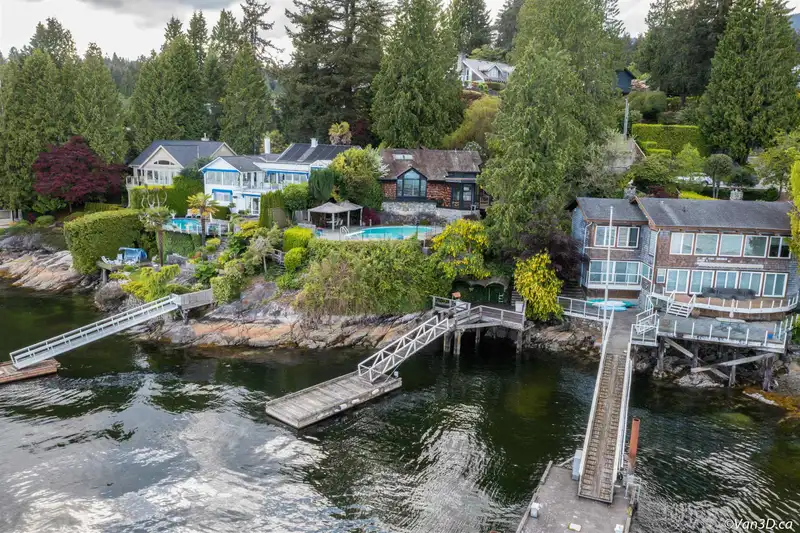
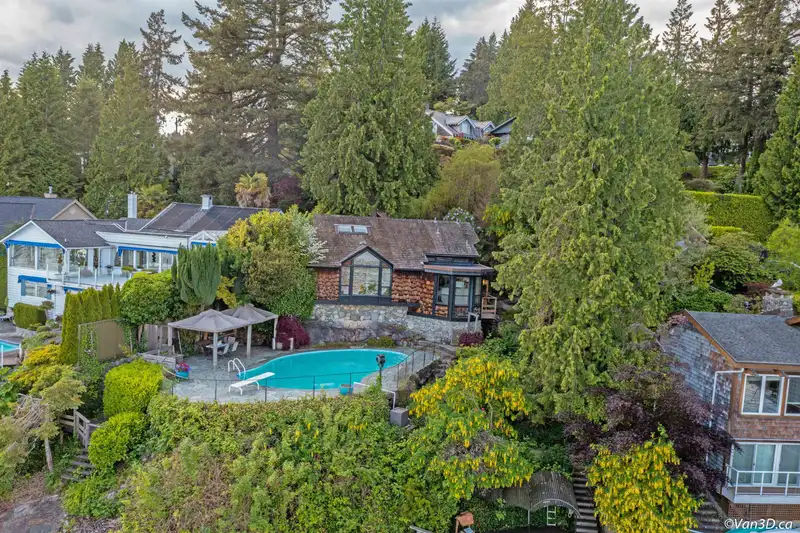
Panoramic ocean and mountain view of this waterfront property situated in the heart of Deep Cove with privacy and serenity. The property offers 8,213 sqft lot with a large swimming pool and outdoor cabana off the pool deck. Enjoy every sunrise, sunset & water sports. The property has exclusive dock.
Features
Property Details
School Catchment
Neighbourhood
Age
- Under 1517.7%
- 15 to 6465.7%
- 65 and over16.6%
Household size
- 1 person15.4%
- 231.8%
- 321.3%
- 423.4%
- 5 or more8%
Language spoken at home
80.8% English mother tongue
Mother tongue, share of 4,040 residents.
How this pocket differs
- notably fewer people living alone than North Vancouver 15.3% vs 28.4%
- notably more 4-person households than North Vancouver 23.3% vs 15.5%
- more 5+ person households than North Vancouver 8% vs 6.4%
- Median household income is notably higher than Metro Vancouver $143,000 vs $90,000
- Median dwelling value is higher than Metro Vancouver $1,510,000 vs $1,050,000
Source: Statistics Canada, Census of Population, 2021. Reproduced and distributed on an "as is" basis with the permission of Statistics Canada.
Land & Development
Zoning, lot dimensions and grade are approximate, from public data, and for reference only — verify with the City / Township of Langley before relying on them.
Recent nearby sales
Sold prices are available to registered users. Log in to see what these sold for.
Monthly Cost Calculator
An estimate only. Canadian semi-annual compounding; excludes utilities, closing costs and BC property transfer tax. 5-year fixed, as of Aug 25
Similar Listings Nearby
4493 EPPS AVENUE
1232 HARRIS AVENUE
687 BEACHVIEW DRIVE
873 BAYCREST DRIVE
4317 CLIFFMONT ROAD
534 BEACHVIEW DRIVE
2136 LOCKEHAVEN ROAD
4678 EASTRIDGE ROAD
1659 DEEP COVE ROAD
575 N DOLLARTON HIGHWAY
1501 OSTLER COURT
2558 PANORAMA DRIVE