
 1 / 40 photos













About This Property
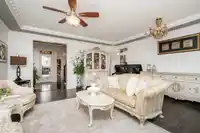
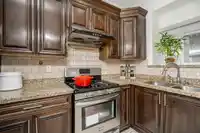
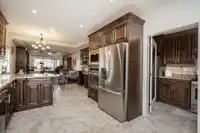
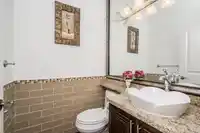
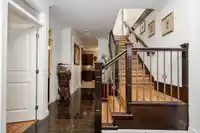
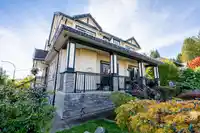
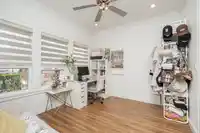
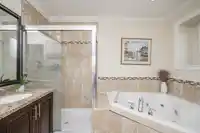
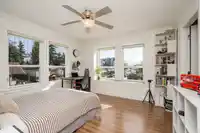
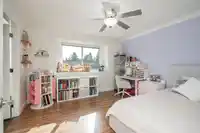
Built in 2015, this well-maintained Burnaby home offers exceptional versatility with TWO RENTAL SUITES generating approx. $3,000/month in combined rental income! Ideal for families, multi-generational living or investors. Extensive upgrades include exterior wall and roof renovations, replacement of wood trim around the eaves (2024), hot water tank (2022),…
Features
Property Details
School Catchment
Neighbourhood
Age
- Under 1514.3%
- 15 to 6466.5%
- 65 and over19.2%
Household size
- 1 person14.9%
- 228.8%
- 316.8%
- 420.2%
- 5 or more19.2%
Language spoken at home
42.4% English mother tongue
Mother tongue, share of 3,275 residents.
How this pocket differs
- notably more 5+ person households than Burnaby South 19.3% vs 7.7%
- notably fewer people living alone than Burnaby South 15% vs 30.4%
- notably more 4-person households than Burnaby South 20.3% vs 12.3%
- notably more Punjabi speakers than Burnaby South 6.1% vs 2.3%
- notably fewer Mandarin speakers than Burnaby South 10.5% vs 17.4%
- fewer Cantonese speakers than Burnaby South 9% vs 11.4%
- Median household income is higher than Metro Vancouver $109,000 vs $90,000
- Median dwelling value is notably higher than Metro Vancouver $1,600,000 vs $1,050,000
Source: Statistics Canada, Census of Population, 2021. Reproduced and distributed on an "as is" basis with the permission of Statistics Canada.
Land & Development
Zoning, lot dimensions and grade are approximate, from public data, and for reference only — verify with the City / Township of Langley before relying on them.
Recent nearby sales
Sold prices are available to registered users. Log in to see what these sold for.
Monthly Cost Calculator
An estimate only. Canadian semi-annual compounding; excludes utilities, closing costs and BC property transfer tax. 5-year fixed, as of Oct 22
Similar Listings Nearby
7865 ROSEWOOD STREET
7148 6TH STREET
7814 ROSEWOOD STREET
7868 ELWELL STREET
7728 ROSEWOOD STREET
7981 ROSEWOOD STREET
8163 18TH AVENUE
7135 4TH STREET
7289 4TH STREET
7865 16TH AVENUE
7830 16TH AVENUE
6550 ALBERY PLACE