
 1 / 15 photos











About This Property
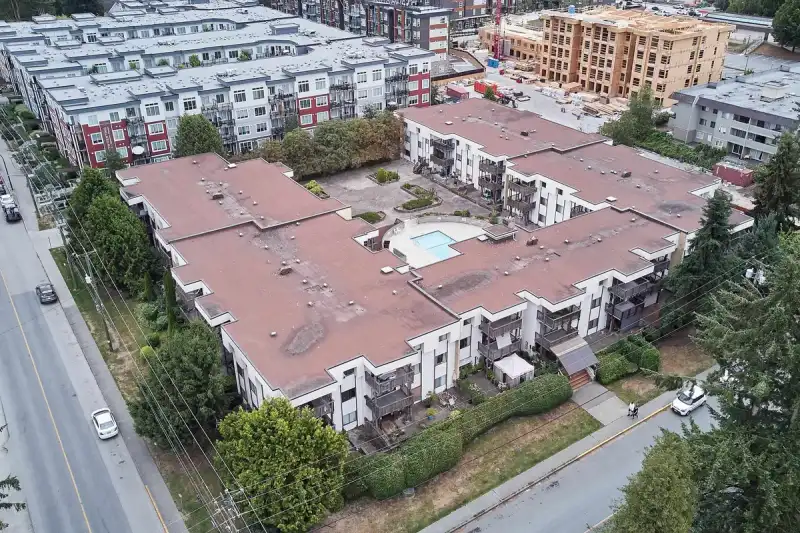
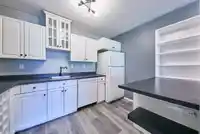
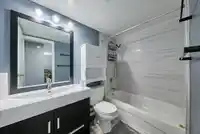
Bright, updated top-floor condo in the heart of Maple Ridge! This spacious open-concept home features a functional layout, updated finishes, and plenty of in-suite storage. Large patio doors fill the living space with natural light and lead to a generous private balcony. Heat and hot water are included in the strata fees, adding excellent value. Wildwood…
Features
Property Details
School Catchment
Neighbourhood
Age
- Under 1512.9%
- 15 to 6462.2%
- 65 and over24.9%
Household size
- 1 person42%
- 233.1%
- 311.6%
- 48.5%
- 5 or more4.8%
Language spoken at home
76.9% English mother tongue
Mother tongue, share of 4,930 residents.
How this pocket differs
- more seniors 65+ than East Central 24.9% vs 20.6%
- notably fewer 5+ person households than East Central 4.8% vs 7.5%
- fewer 4-person households than East Central 8.5% vs 12.3%
- more people living alone than East Central 41.9% vs 32.5%
- Median household income is lower than Metro Vancouver $65,000 vs $90,000
- Median dwelling value is notably lower than Metro Vancouver $512,000 vs $1,050,000
Source: Statistics Canada, Census of Population, 2021. Reproduced and distributed on an "as is" basis with the permission of Statistics Canada.
Recent nearby sales
Sold prices are available to registered users. Log in to see what these sold for.
Monthly Cost Calculator
An estimate only. Canadian semi-annual compounding; excludes utilities, closing costs and BC property transfer tax. 5-year fixed, as of Oct 19
Similar Listings Nearby
319 12170 222 STREET
311 12170 222 STREET
307 12170 222 STREET
314 12170 222ND STREET
107 12096 222 STREET
105 12096 222 STREET
207 12096 222 STREET
206 22277 122 AVENUE
204 11671 FRASER STREET
A311 8233 208B STREET STREET
A114 20838 78B AVENUE
101 20727 DOUGLAS CRESCENT