
 1 / 32 photos












About This Property
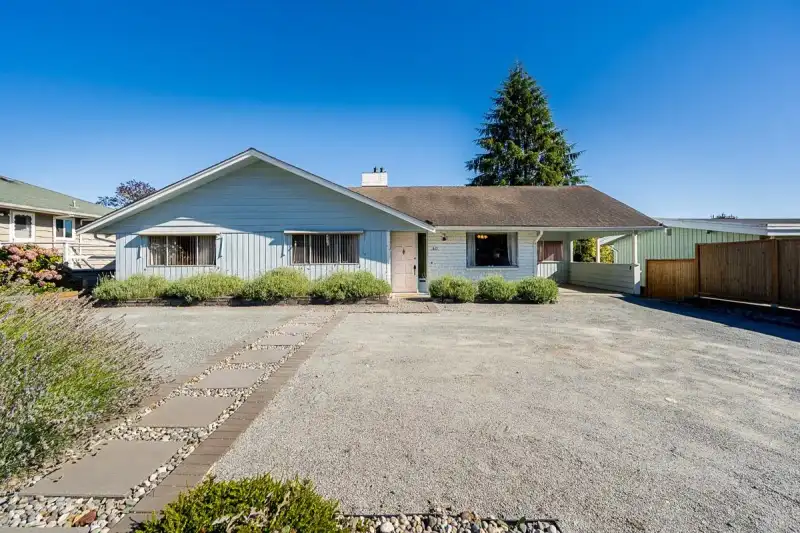
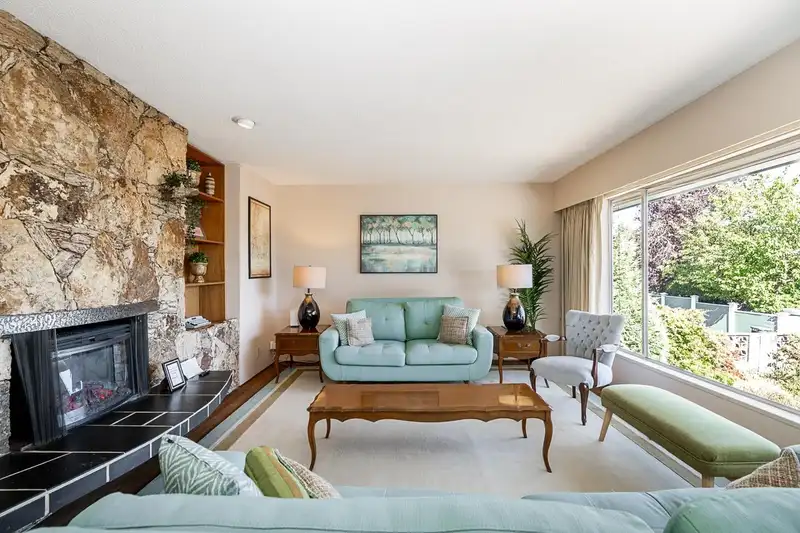
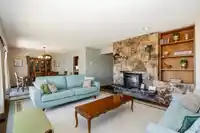
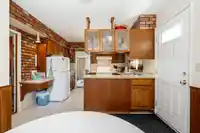
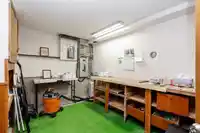
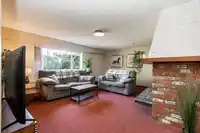
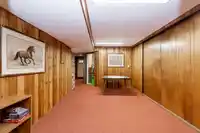
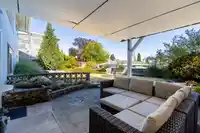
This mid-century rancher with a walk-out basement carries its original charm while offering several important updates, including hot water on demand, a 200-amp electrical panel, air conditioning, and more. This 5 bedroom, 3 bathroom home features almost 3,000 square feet (1,485 on each level), with a separate entrance to the lower level, making it perfect…
Property Details
School Catchment
Neighbourhood
Age
- Under 1516.2%
- 15 to 6467.9%
- 65 and over15.9%
Household size
- 1 person20.1%
- 231%
- 320.1%
- 418.7%
- 5 or more10.2%
Language spoken at home
69.4% English mother tongue
Mother tongue, share of 3,890 residents.
How this pocket differs
- more children under 15 than New Westminster 16.2% vs 12.6%
- notably more 5+ person households than New Westminster 10.2% vs 5.3%
- notably more 4-person households than New Westminster 18.7% vs 10%
- notably fewer people living alone than New Westminster 20.1% vs 36.8%
- Median household income is higher than Metro Vancouver $117,000 vs $90,000
Source: Statistics Canada, Census of Population, 2021. Reproduced and distributed on an "as is" basis with the permission of Statistics Canada.
Land & Development
Zoning, lot dimensions and grade are approximate, from public data, and for reference only — verify with the City / Township of Langley before relying on them.
Recent nearby sales
Sold prices are available to registered users. Log in to see what these sold for.
Monthly Cost Calculator
An estimate only. Canadian semi-annual compounding; excludes utilities, closing costs and BC property transfer tax. 5-year fixed, as of Nov 5
Similar Listings Nearby
50 E 10TH AVENUE
8391 11TH AVENUE
8259 10TH AVENUE
8247 10TH AVENUE
112 TENTH AVENUE
112 DURHAM STREET
131 RICKMAN PLACE
201 OSBORNE AVENUE
730 CUMBERLAND STREET
7888 COQUITLAM STREET
215 NINTH AVENUE
8085 10TH AVENUE