
 1 / 20 photos


About This Property
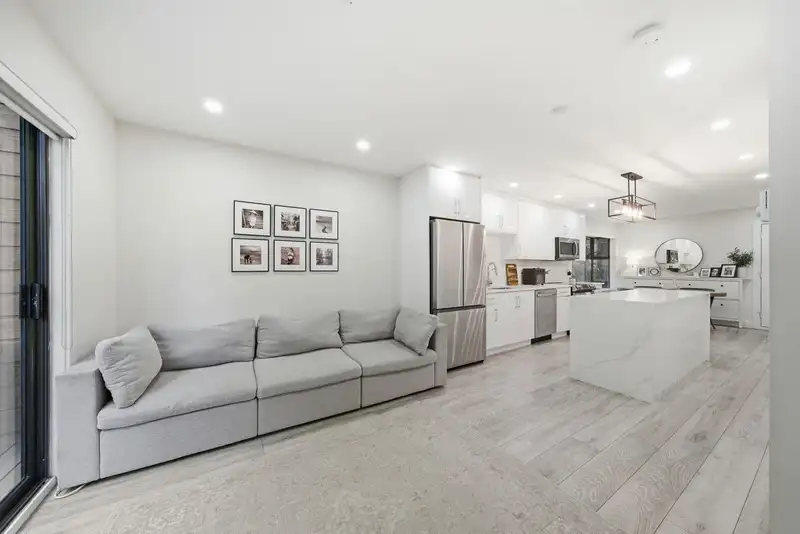
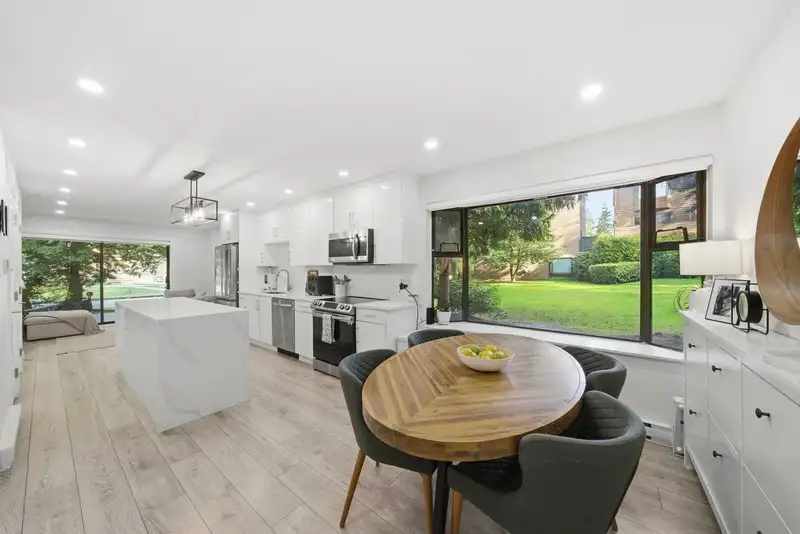
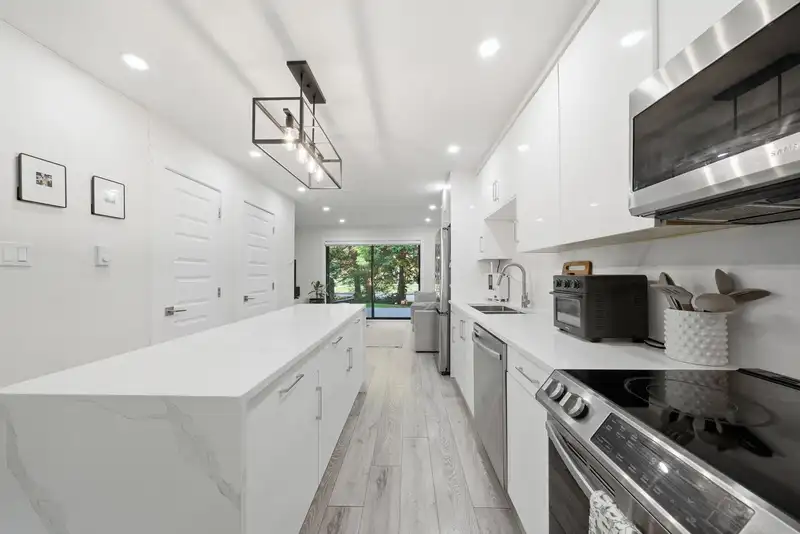
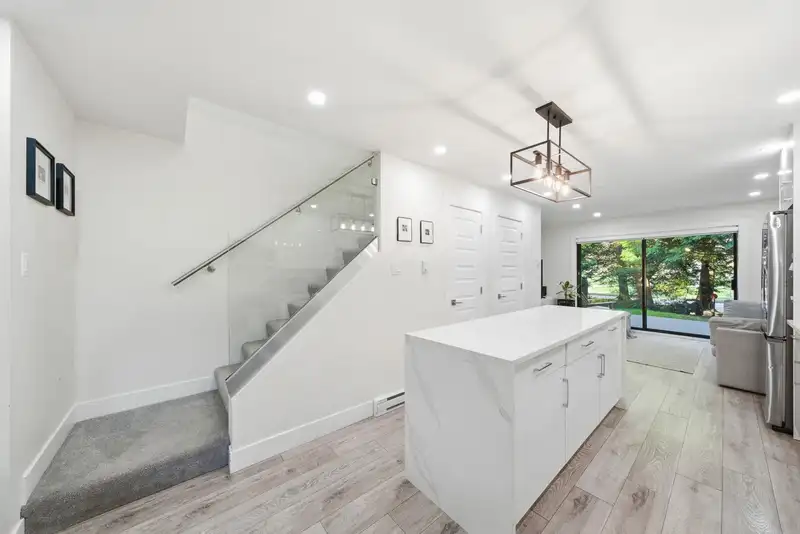
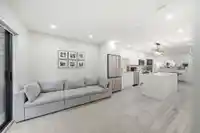
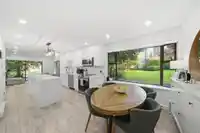
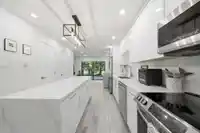
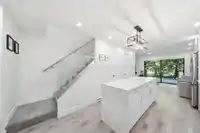
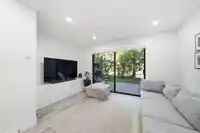
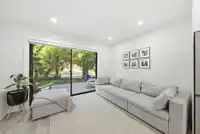
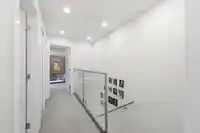
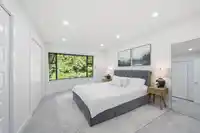
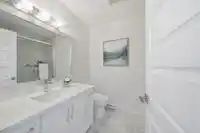
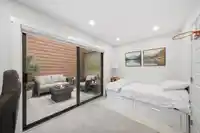
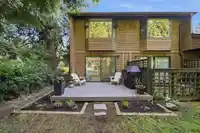
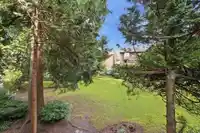
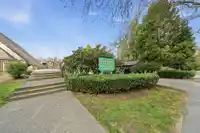
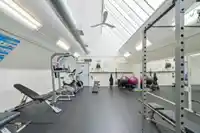
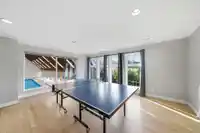
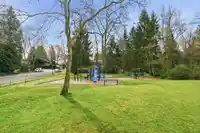
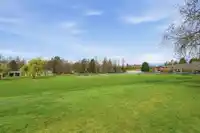
An exceptional opportunity to own a fully renovated 2-bedroom, 2-bath corner townhome, perfectly positioned alongside lush green space in the highly desirable Greentree Village community. This elegant residence showcases refined finishes throughout, featuring quartz countertops, stainless steel appliances, a built-in Bluetooth audio system, and convenient…
Features
Property Details
School Catchment
Neighbourhood
Age
- Under 1514%
- 15 to 6465%
- 65 and over21%
Household size
- 1 person18.8%
- 232.6%
- 318.8%
- 419%
- 5 or more10.9%
Language spoken at home
52.3% English mother tongue
Mother tongue, share of 5,335 residents.
How this pocket differs
- notably fewer people living alone than Burnaby South 18.8% vs 30.4%
- notably more 4-person households than Burnaby South 19% vs 12.3%
- more 5+ person households than Burnaby South 10.9% vs 7.7%
- notably fewer Cantonese speakers than Burnaby South 6.6% vs 11.4%
- notably fewer Mandarin speakers than Burnaby South 11.4% vs 17.4%
- Median household income is higher than Metro Vancouver $115,000 vs $90,000
Source: Statistics Canada, Census of Population, 2021. Reproduced and distributed on an "as is" basis with the permission of Statistics Canada.
Monthly Cost Calculator
An estimate only. Canadian semi-annual compounding; excludes utilities, closing costs and BC property transfer tax. 5-year fixed, as of Nov 5
Similar Listings Nearby
4384 GARDEN GROVE DRIVE
4212 GARDEN GROVE DRIVE
21 5655 CHAFFEY AVENUE
22 5655 CHAFFEY AVENUE
7 5525 HALLEY AVENUE
4818 HAZEL STREET
13 4288 SARDIS STREET
TH103 2351 BETA AVENUE
105 2378 ALPHA AVENUE
106 4433 ALASKA STREET
401 6240 MCKAY AVENUE
2609 4730 LOUGHEED HIGHWAY