
 1 / 40 photos








About This Property
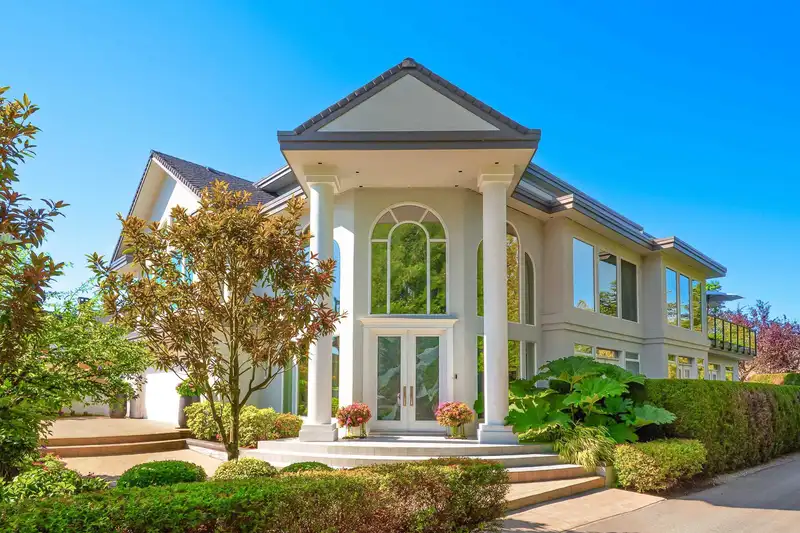
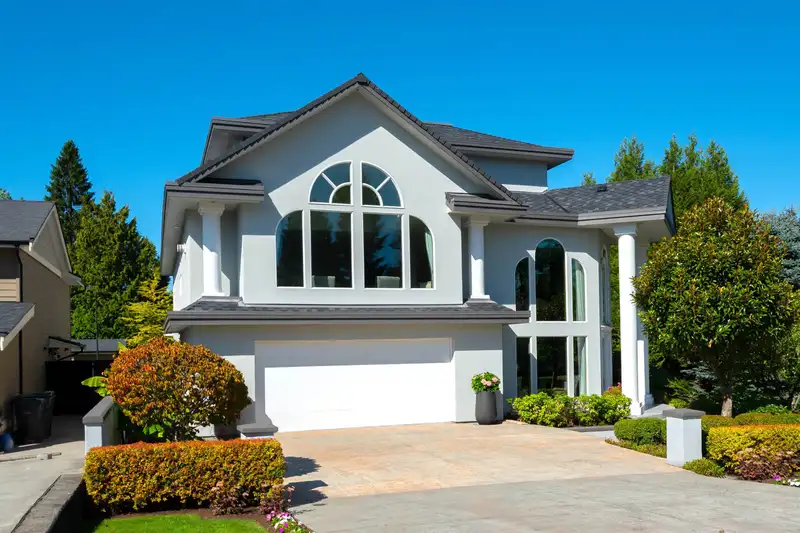
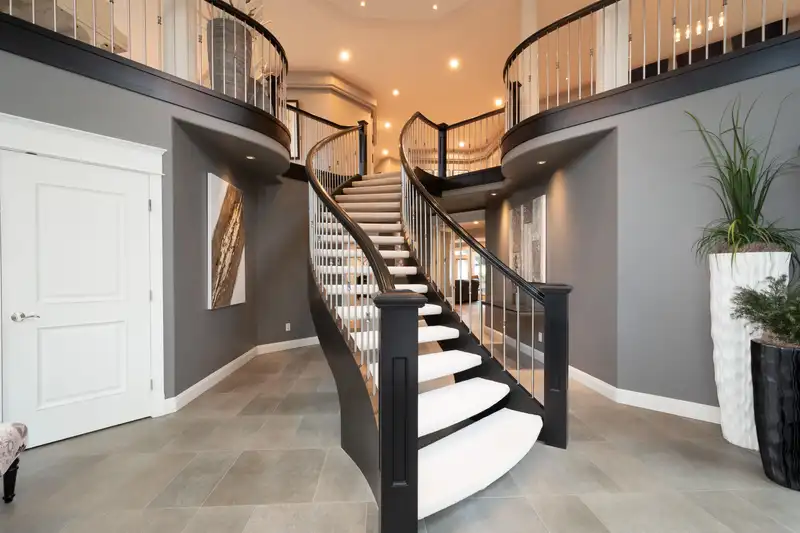
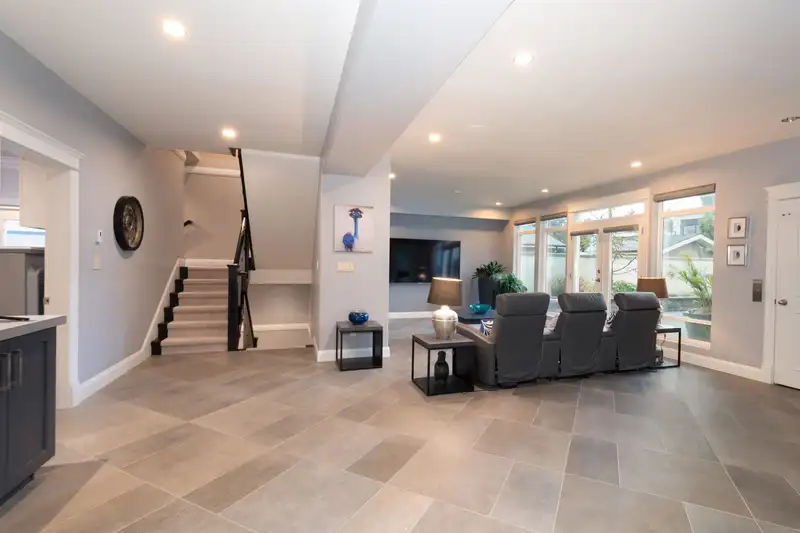
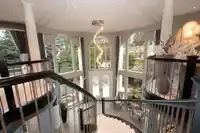
COQUITLAM WATERFRONT! Rare opportunity to own a custom 9,000 sq ft lakefront estate with direct access to Como Lake. This exceptional home offers a grand foyer with 18-ft ceilings and sweeping staircase, main floor bedrooms, games and rec rooms, and seamless access to a private backyard ideal for outdoor living. The living level features an elegant living…
Property Details
School Catchment
Neighbourhood
Age
- Under 1514.7%
- 15 to 6465.9%
- 65 and over19.4%
Household size
- 1 person16%
- 228%
- 320.7%
- 421.5%
- 5 or more13.9%
Language spoken at home
57.9% English mother tongue
Mother tongue, share of 5,700 residents.
How this pocket differs
- notably fewer people living alone than Central Coquitlam 16% vs 25.7%
- more 4-person households than Central Coquitlam 21.5% vs 16.9%
- more 5+ person households than Central Coquitlam 13.9% vs 11.2%
- more Mandarin speakers than Central Coquitlam 9% vs 6.2%
- Median household income is higher than Metro Vancouver $119,000 vs $90,000
- Median dwelling value is higher than Metro Vancouver $1,510,000 vs $1,050,000
Source: Statistics Canada, Census of Population, 2021. Reproduced and distributed on an "as is" basis with the permission of Statistics Canada.
Land & Development
Zoning, lot dimensions and grade are approximate, from public data, and for reference only — verify with the City / Township of Langley before relying on them.
Recent nearby sales
Sold prices are available to registered users. Log in to see what these sold for.
Monthly Cost Calculator
An estimate only. Canadian semi-annual compounding; excludes utilities, closing costs and BC property transfer tax. 5-year fixed, as of Aug 26
Similar Listings Nearby
1130 SMITH AVENUE
1059 CORNELL AVENUE
1211 FOSTER AVENUE
731 GATENSBURY STREET
687 FOLSOM STREET
1100 COMO LAKE AVENUE
730 SCHOOLHOUSE STREET
656 BLUE MOUNTAIN STREET
1575 CORNELL AVENUE
841 RONDEAU STREET
520 BLUE MOUNTAIN STREET
897 COTTONWOOD AVENUE