
 1 / 17 photos












About This Property
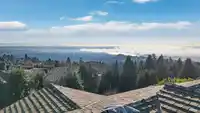
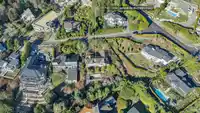
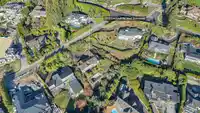
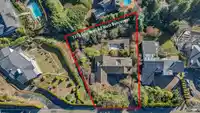
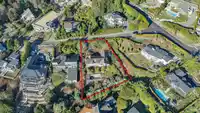
Builder & Investor Alert! A rare opportunity to own a prime 21,000 sq. ft. lot in Chartwell, West Vancouver, one of the area’s most prestigious neighborhoods. Enjoy unbeatable ocean views from Grouse Mountain to Burrard Inlet. Features a gentle slope and surrounded by multi million dollar homes. Come and build your new luxury masterpiece. Zoned RS-3, this…
Features
Property Details
School Catchment
Neighbourhood
Age
- Under 1516.9%
- 15 to 6463.7%
- 65 and over19.4%
Household size
- 1 person14.5%
- 230.2%
- 319.4%
- 422.8%
- 5 or more13.1%
Language spoken at home
43.2% English mother tongue
Mother tongue, share of 5,210 residents.
How this pocket differs
- fewer seniors 65+ than West Vancouver 19.4% vs 28.1%
- more children under 15 than West Vancouver 16.9% vs 13.7%
- notably fewer people living alone than West Vancouver 14.5% vs 28.8%
- notably more 5+ person households than West Vancouver 13.1% vs 7.8%
- notably more 4-person households than West Vancouver 22.7% vs 14.8%
- notably more Cantonese speakers than West Vancouver 3.9% vs 2.1%
- Median household income is higher than Metro Vancouver $120,000 vs $90,000
- Median dwelling value is notably higher than Metro Vancouver $3,480,000 vs $1,050,000
Source: Statistics Canada, Census of Population, 2021. Reproduced and distributed on an "as is" basis with the permission of Statistics Canada.
Land & Development
Zoning, lot dimensions and grade are approximate, from public data, and for reference only — verify with the City / Township of Langley before relying on them.
Recent nearby sales
Sold prices are available to registered users. Log in to see what these sold for.
Monthly Cost Calculator
An estimate only. Canadian semi-annual compounding; excludes utilities, closing costs and BC property transfer tax. 5-year fixed, as of Oct 22
Similar Listings Nearby
1135 GROVELAND COURT
1130 EYREMOUNT DRIVE
1109 HIGHLAND DRIVE
1448 SANDHURST PLACE
1444 SANDHURST PLACE
1035 KING GEORGES WAY
1440 SANDHURST PLACE
1084 GROVELAND ROAD
1375 BURNSIDE ROAD
1441 CHARTWELL DRIVE
1109 HILLSIDE ROAD
1162 MILLSTREAM ROAD