
 1 / 40 photos















About This Property
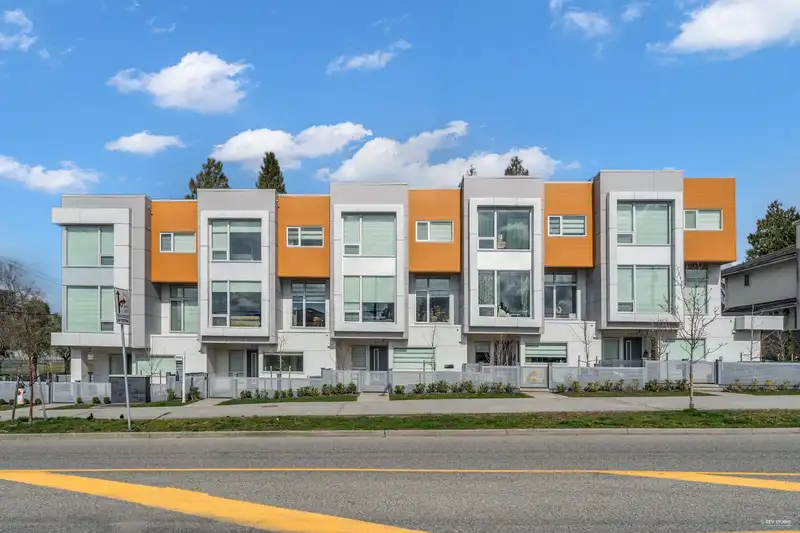
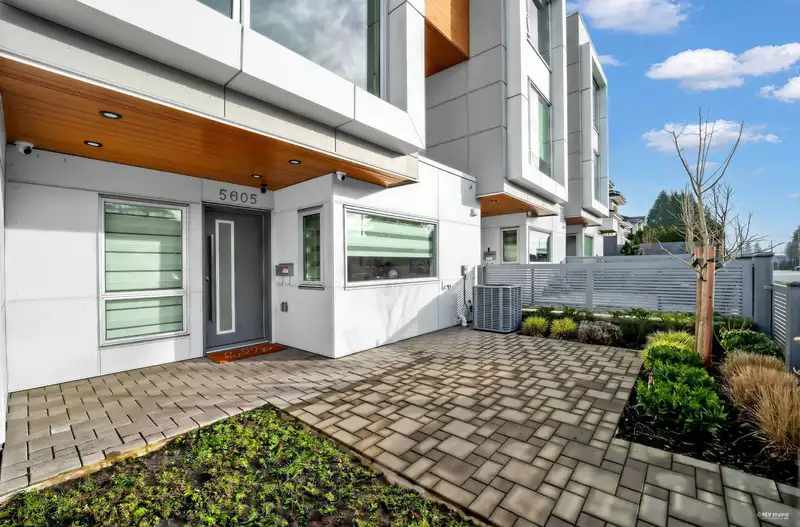
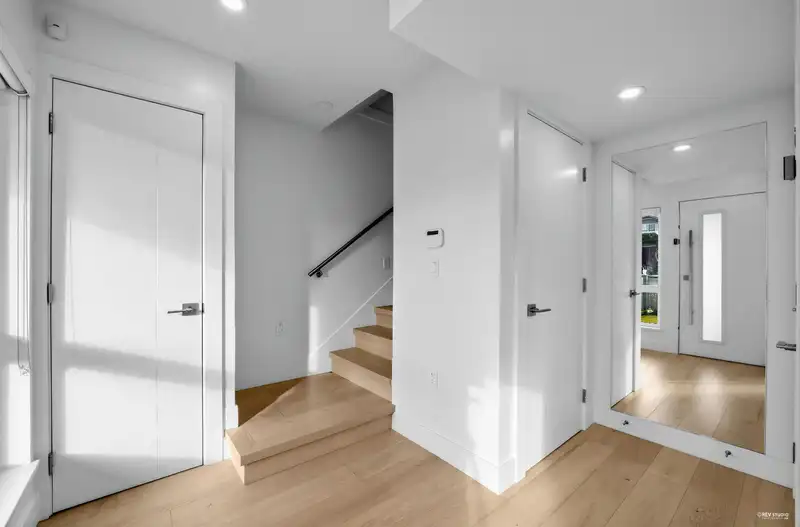
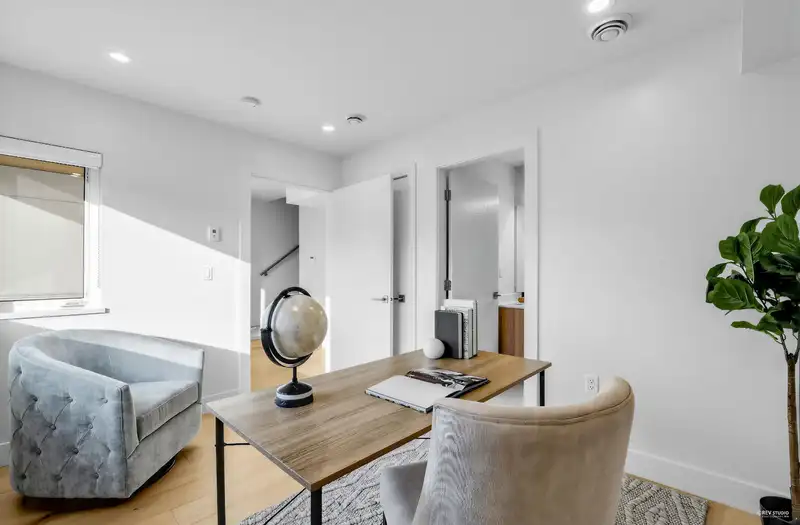
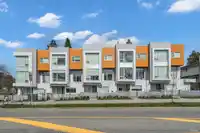
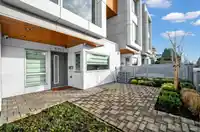
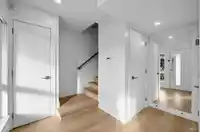
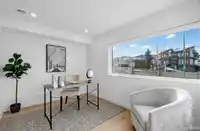
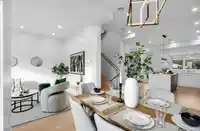
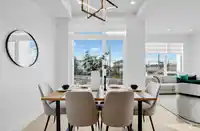
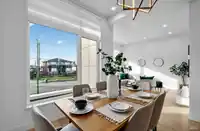
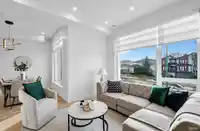
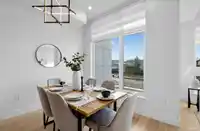
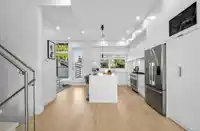
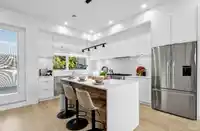
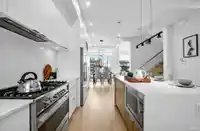
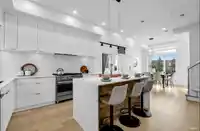
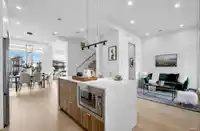
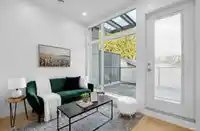
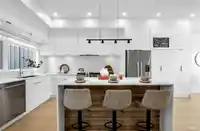
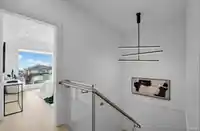
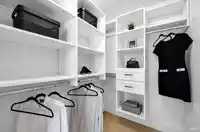
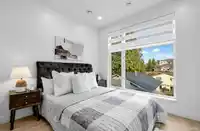
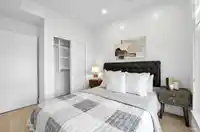
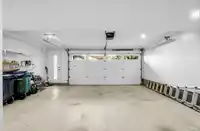
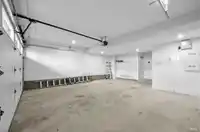
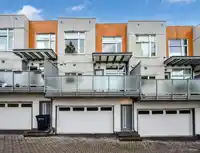
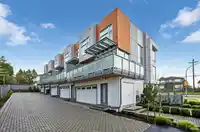
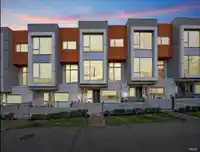
Rare, single-house-style townhouse by Bima Properties. This sophisticated, three-story residence features a modern design with 4 bedrooms and 3.5 bathrooms, offering both style and functionality. With direct street access and its own unique street number, this home is perfect for families seeking comfort and luxury. The property is equipped with highly…
Features
Property Details
School Catchment
Neighbourhood
Age
- Under 1514%
- 15 to 6470.5%
- 65 and over15.5%
Household size
- 1 person23.5%
- 229.9%
- 320.4%
- 415.6%
- 5 or more10.6%
Language spoken at home
34.8% English mother tongue
Mother tongue, share of 7,505 residents.
How this pocket differs
- more children under 15 than Metrotown 14% vs 11%
- notably more 5+ person households than Metrotown 10.7% vs 4.6%
- notably more 4-person households than Metrotown 15.6% vs 9.2%
- fewer people living alone than Metrotown 23.6% vs 34.9%
- notably more Punjabi speakers than Metrotown 3.5% vs 1.6%
- more Cantonese speakers than Metrotown 14.4% vs 11.3%
Source: Statistics Canada, Census of Population, 2021. Reproduced and distributed on an "as is" basis with the permission of Statistics Canada.
Recent nearby sales
Sold prices are available to registered users. Log in to see what these sold for.
Monthly Cost Calculator
An estimate only. Canadian semi-annual compounding; excludes utilities, closing costs and BC property transfer tax. 5-year fixed, as of Nov 4
Similar Listings Nearby
5601 RUMBLE STREET
160 7388 MACPHERSON AVENUE
109 7232 MACPHERSON AVENUE
114 6085 IRMIN STREET
206 6085 IRMIN STREET
302 6085 IRMIN STREET
6 6136 IRMIN STREET
35 6868 BURLINGTON AVENUE
107 7533 GILLEY AVENUE
15 6288 BERESFORD STREET
11 6288 BERESFORD STREET
6693 MARLBOROUGH AVENUE