
 1 / 9 photos


About This Property
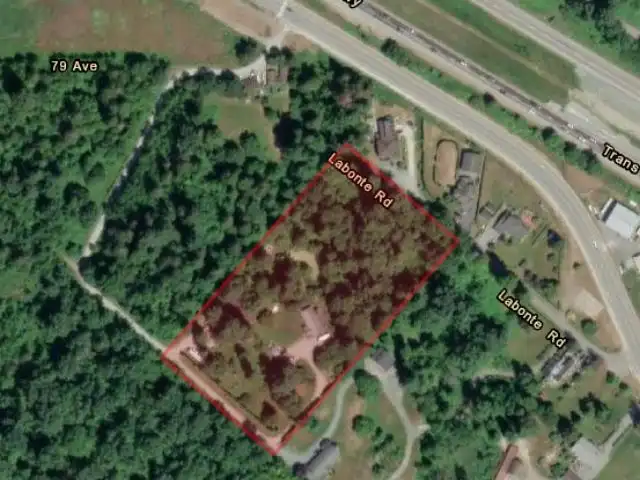
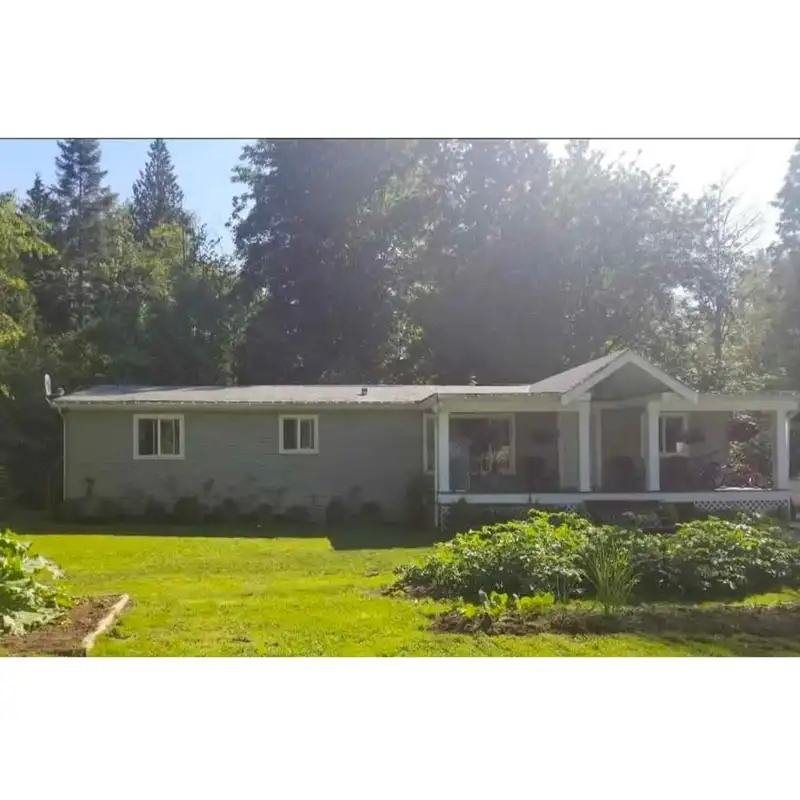
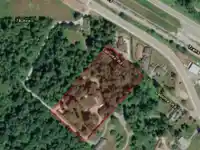
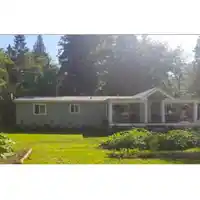
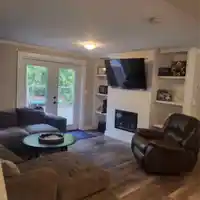
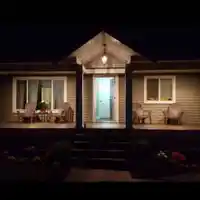
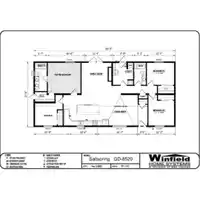
It's your chance now!! Welcome to this exceptional 4.75-acre property offers a unique blend of residential and commercial potential (Subject to ALC approval). Ideally situated with easy access to Highway 1, Glover Road, and 216th Street, this location provides seamless connectivity. Property presents a 1999 built mobile home, workshop and a 2nd double-wide…
Features
Property Details
School Catchment
Neighbourhood
Age
- Under 1524.8%
- 15 to 6468%
- 65 and over7.2%
Household size
- 1 person14.2%
- 222.5%
- 318.9%
- 425.2%
- 5 or more19.2%
Language spoken at home
60.5% English mother tongue
Mother tongue, share of 4,920 residents.
How this pocket differs
- fewer seniors 65+ than Willoughby Heights 7.2% vs 10%
- notably more 5+ person households than Willoughby Heights 19.3% vs 11.6%
- fewer people living alone than Willoughby Heights 14.3% vs 19.3%
- more 4-person households than Willoughby Heights 25.2% vs 20.4%
- Median household income is higher than Metro Vancouver $121,000 vs $90,000
Source: Statistics Canada, Census of Population, 2021. Reproduced and distributed on an "as is" basis with the permission of Statistics Canada.
Monthly Cost Calculator
An estimate only. Canadian semi-annual compounding; excludes utilities, closing costs and BC property transfer tax. 5-year fixed, as of Oct 22
Similar Listings Nearby
LT42 76B CRESCENT
21424 64 AVENUE
#LT.E GLOVER ROAD
LOT B ROYAL STREET
20248 98A AVENUE
23250 FRASER HIGHWAY
11655 BURNETT STREET
22147 CLIFF AVENUE
22155 CLIFF AVENUE
22137 CLIFF AVENUE
22127 CLIFF AVENUE
22165 CLIFF AVENUE