
 1 / 23 photos
About This Property
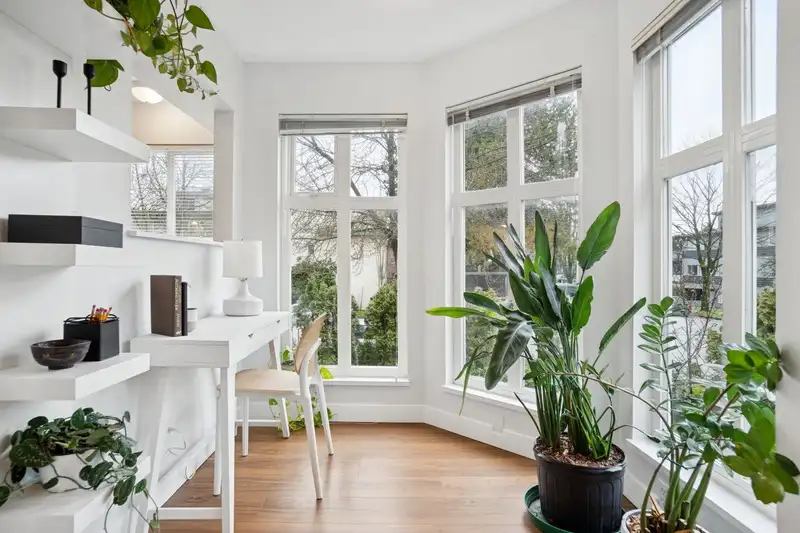
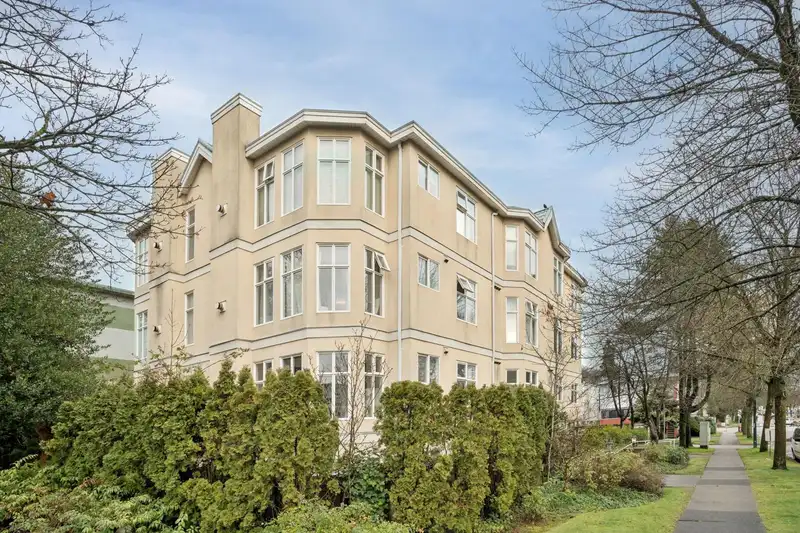
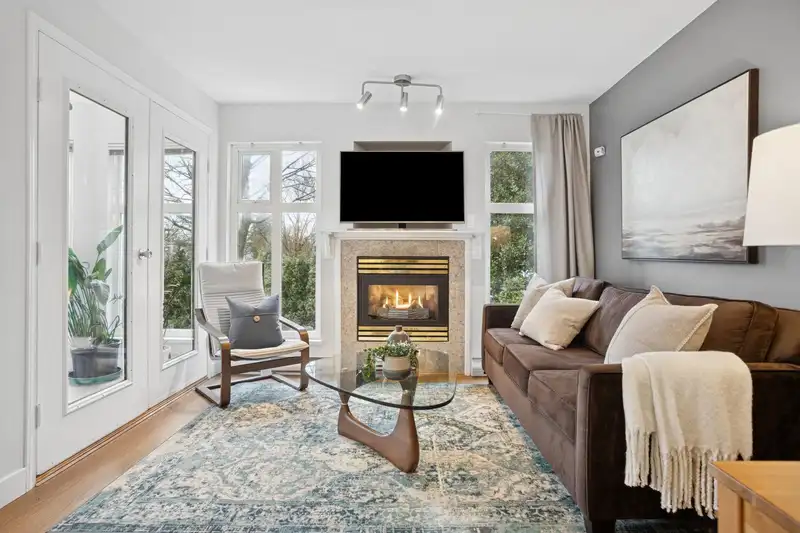
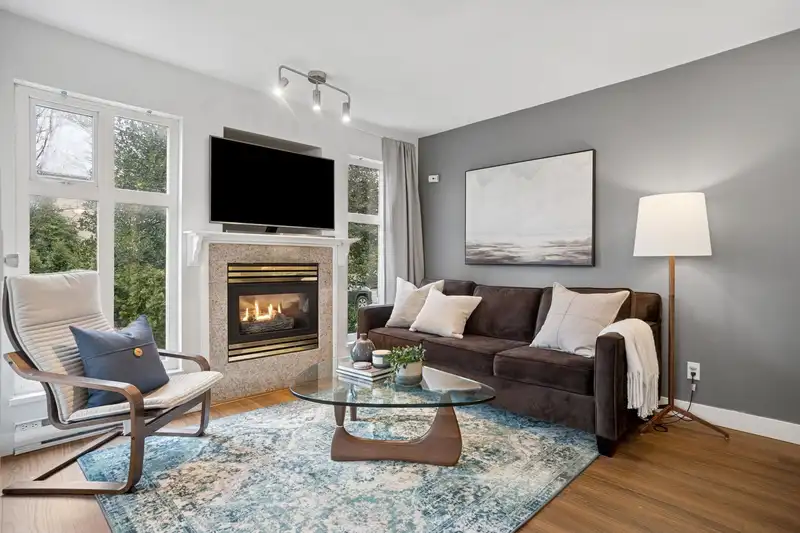
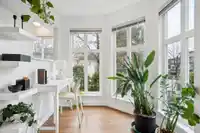
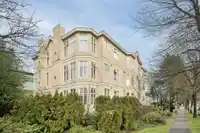
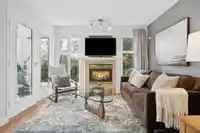
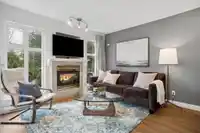
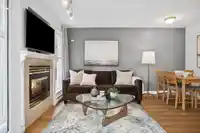
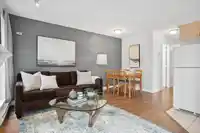
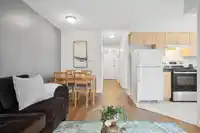
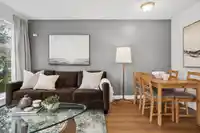
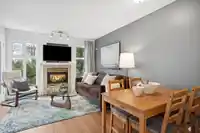
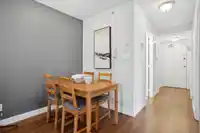
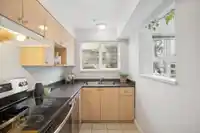
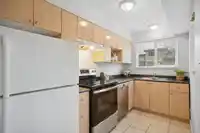
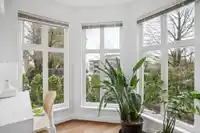
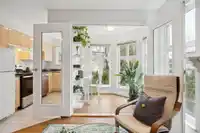
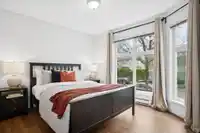
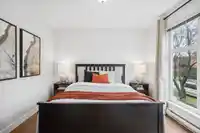
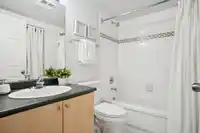
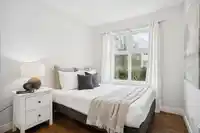
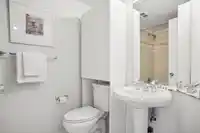
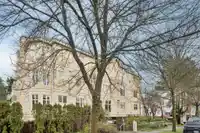
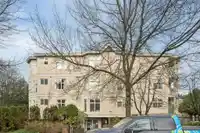
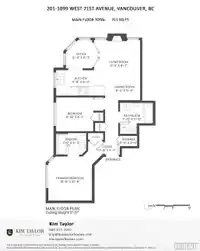
Bright southwest corner home at Osler Place in the heart of Marpole. This renovated 2 bedroom, 2 full bathroom plus office/den residence is filled with natural light and offers a smart, functional layout ideal for professionals, couples, or small families. Open living and dining areas flow seamlessly and are anchored by a cozy gas fireplace, perfect for…
Features
Property Details
School Catchment
Neighbourhood
Age
- Under 158.2%
- 15 to 6479%
- 65 and over12.9%
Household size
- 1 person54.6%
- 230%
- 39.2%
- 44.3%
- 5 or more2%
Language spoken at home
48.3% English mother tongue
Mother tongue, share of 7,150 residents.
How this pocket differs
- fewer children under 15 than Marpole 8.2% vs 10.7%
- fewer seniors 65+ than Marpole 12.9% vs 16.7%
- notably fewer 5+ person households than Marpole 2% vs 5.9%
- notably fewer 4-person households than Marpole 4.3% vs 10%
- more people living alone than Marpole 54.6% vs 39.4%
- notably fewer Cantonese speakers than Marpole 3.5% vs 16.4%
- Median household income is notably lower than Metro Vancouver $57,200 vs $90,000
- Median dwelling value is notably lower than Metro Vancouver $500,000 vs $1,050,000
Source: Statistics Canada, Census of Population, 2021. Reproduced and distributed on an "as is" basis with the permission of Statistics Canada.
Recent nearby sales
Sold prices are available to registered users. Log in to see what these sold for.
Monthly Cost Calculator
An estimate only. Canadian semi-annual compounding; excludes utilities, closing costs and BC property transfer tax. 5-year fixed, as of Nov 19
Similar Listings Nearby
301 1099 W 71ST AVENUE
401 1099 W 71ST AVENUE
301 8645 OSLER STREET
101 8645 OSLER STREET
108 8622 SELKIRK STREET
104 8486 OAK STREET
306 8486 OAK STREET
505 8888 OSLER STREET
504 8888 OSLER STREET
209 8486 OAK STREET
211 8398 OAK STREET
209 8398 OAK STREET