
 1 / 29 photos










About This Property
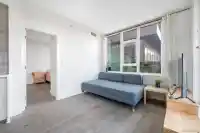
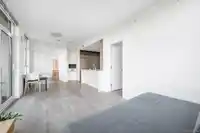
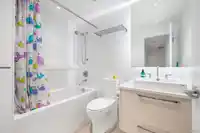
Experience Elevated Living at Highgate Village! Corner Unit at Kings Crossing III by Cressey-where modern design meets urban sophistication. Boasting 885 sq/ft of meticulously crafted living space, this 2-bedroom, 2-bathroom home offers an exceptional blend of style and functionality. Soaring 9-foot ceilings and floor-to-ceiling windows flood the space with…
Features
Property Details
School Catchment
Neighbourhood
Age
- Under 1514.8%
- 15 to 6473.7%
- 65 and over11.4%
Household size
- 1 person28.7%
- 231.6%
- 316%
- 413.3%
- 5 or more10.4%
Language spoken at home
28.6% English mother tongue
Mother tongue, share of 6,095 residents.
How this pocket differs
- fewer seniors 65+ than Burnaby East 11.4% vs 16.2%
- more people living alone than Burnaby East 28.8% vs 21.5%
- fewer 4-person households than Burnaby East 13.3% vs 16.8%
- notably fewer Punjabi speakers than Burnaby East 3% vs 5.1%
- more Tagalog speakers than Burnaby East 7.8% vs 5.7%
Source: Statistics Canada, Census of Population, 2021. Reproduced and distributed on an "as is" basis with the permission of Statistics Canada.
Recent nearby sales
Sold prices are available to registered users. Log in to see what these sold for.
Monthly Cost Calculator
An estimate only. Canadian semi-annual compounding; excludes utilities, closing costs and BC property transfer tax. 5-year fixed, as of Sep 10
Similar Listings Nearby
408 7303 NOBLE LANE
911 7388 KINGSWAY
2301 7388 KINGSWAY
3006 7388 KINGSWAY
2909 7388 KINGSWAY
1105 7358 EDMONDS STREET
2906 7358 EDMONDS STREET
2207 7328 ARCOLA STREET
1805 7328 ARCOLA STREET
1205 7328 ARCOLA STREET
504 7328 ARCOLA STREET
2101 7325 ARCOLA STREET