
 1 / 40 photos


About This Property
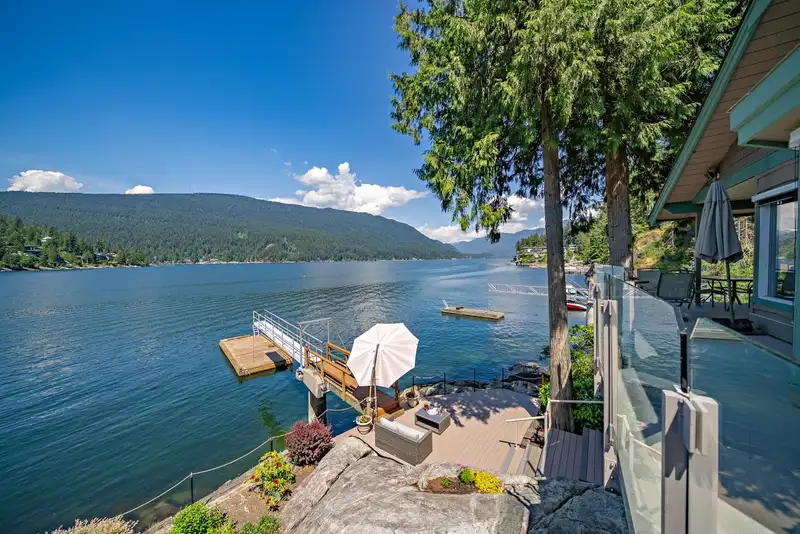
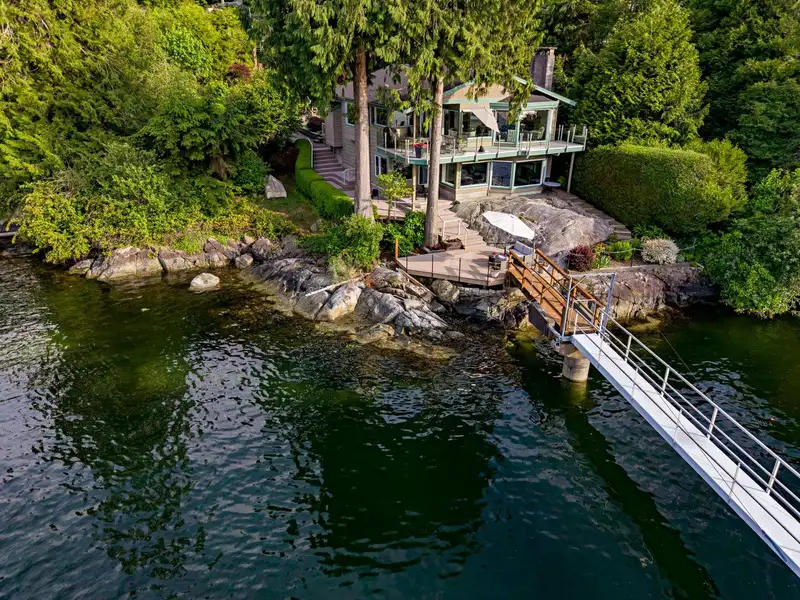
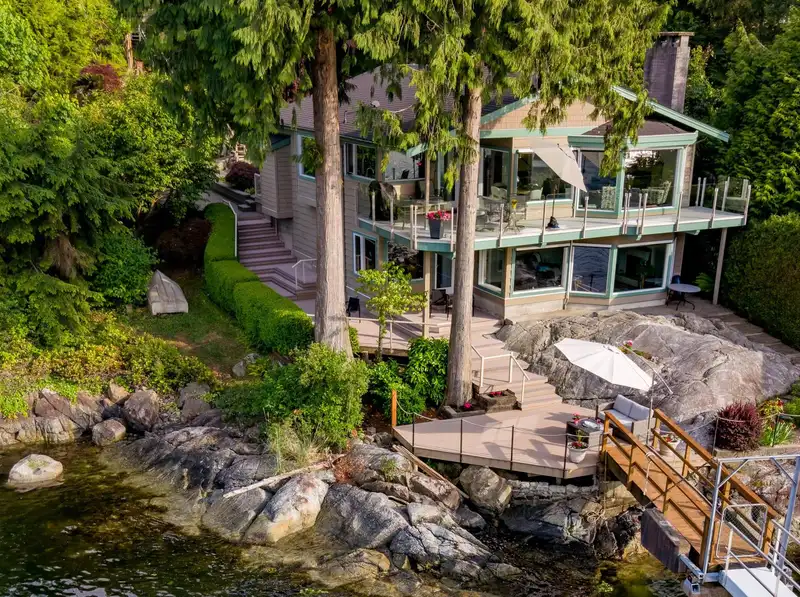
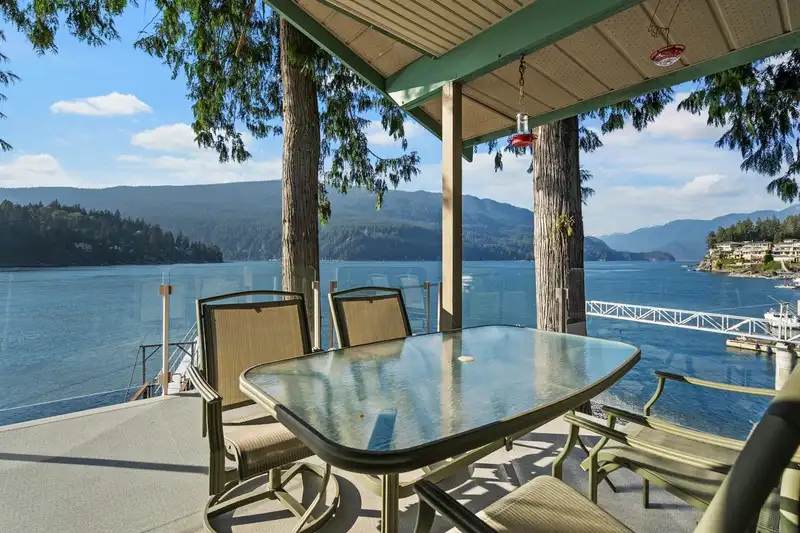
Truly Spectacular Oceanfront Home. Imagine waking up each day to panoramic Indian Arm views and golden sunsets from your own Belcarra waterfront paradise. This bright and sunny low-bank home offers the rare feeling of living right on the water, complete with a PRIVATE DOCK at your doorstep. Expansive patios create seamless indoor-outdoor living, perfect for…
Property Details
School Catchment
Neighbourhood
Age
- Under 1514%
- 15 to 6466.4%
- 65 and over19.6%
Household size
- 1 person13.8%
- 236.9%
- 317.5%
- 419.1%
- 5 or more12.8%
Language spoken at home
75.6% English mother tongue
Mother tongue, share of 4,640 residents.
How this pocket differs
- more seniors 65+ than Port Moody 19.6% vs 15.1%
- notably more 5+ person households than Port Moody 12.8% vs 7.3%
- notably fewer people living alone than Port Moody 13.8% vs 21.5%
- Median household income is notably higher than Metro Vancouver $150,000 vs $90,000
- Median dwelling value is notably higher than Metro Vancouver $2,000,000 vs $1,050,000
Source: Statistics Canada, Census of Population, 2021. Reproduced and distributed on an "as is" basis with the permission of Statistics Canada.
Land & Development
Zoning, lot dimensions and grade are approximate, from public data, and for reference only — verify with the City / Township of Langley before relying on them.
Monthly Cost Calculator
An estimate only. Canadian semi-annual compounding; excludes utilities, closing costs and BC property transfer tax. 5-year fixed, as of Nov 12
Similar Listings Nearby
184 TURTLEHEAD ROAD
4695 BELCARRA BAY ROAD
5225 COOMBE LANE
4675 LOCKEHAVEN PLACE
4545 STRATHCONA ROAD
2867 PANORAMA DRIVE
791 BEACHVIEW DRIVE
687 BEACHVIEW DRIVE
2660 PANORAMA DRIVE
2648 PANORAMA DRIVE
4317 CLIFFMONT ROAD
534 BEACHVIEW DRIVE