
 1 / 30 photos








About This Property
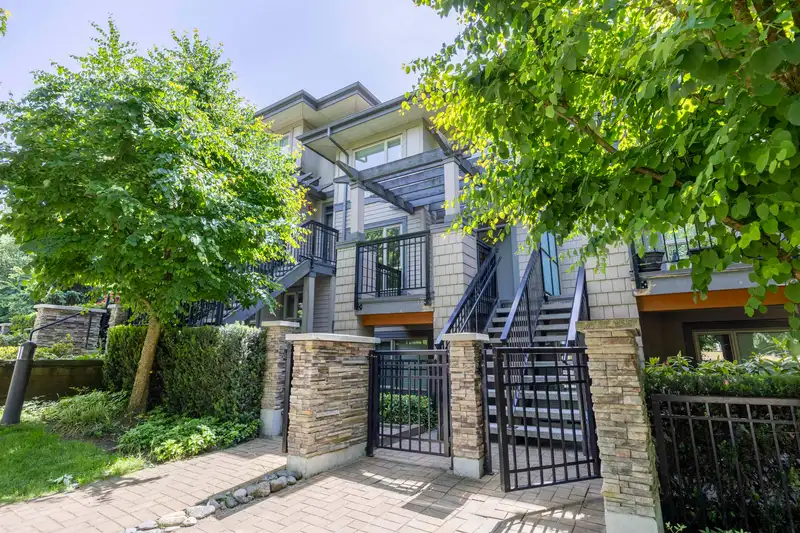
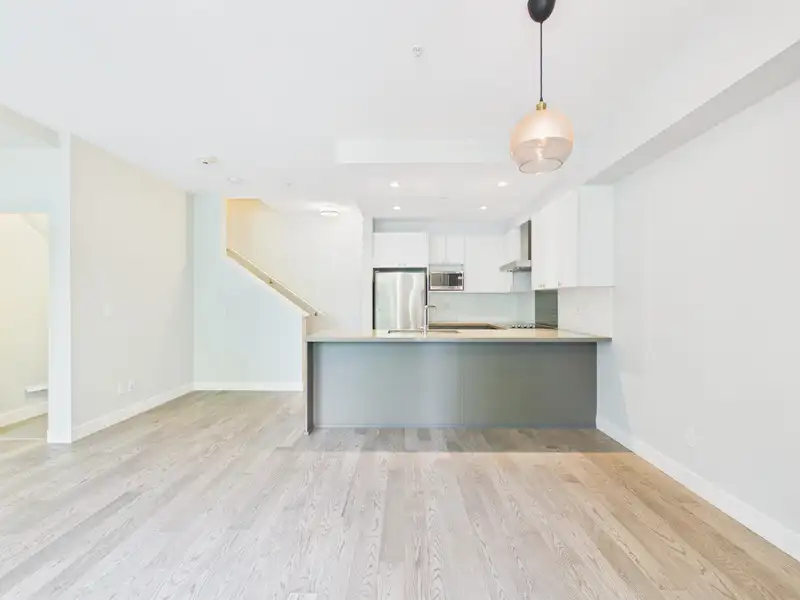
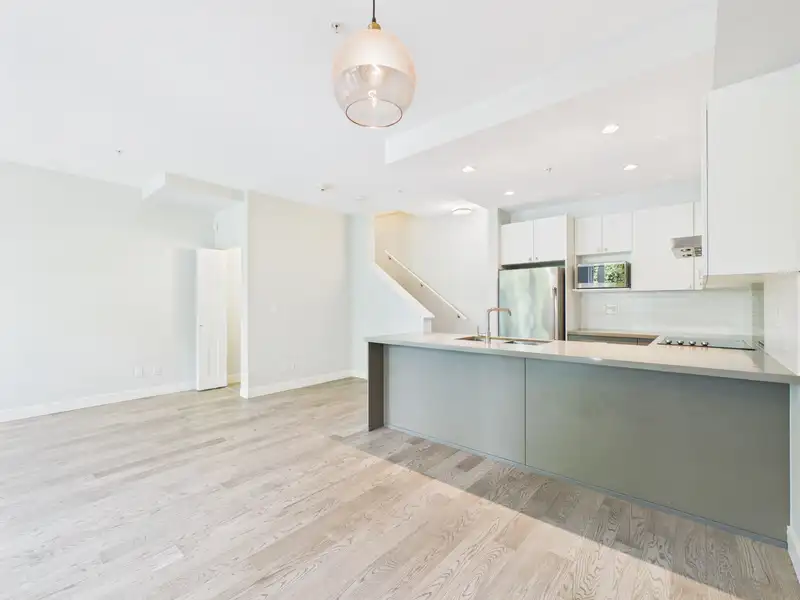
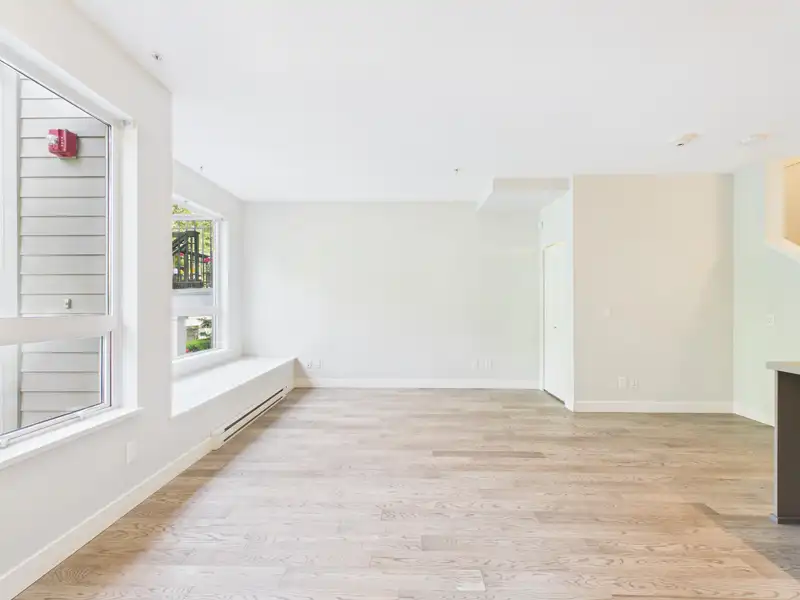
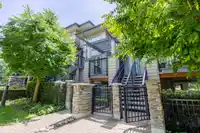
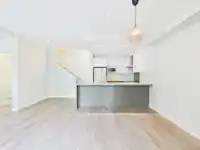
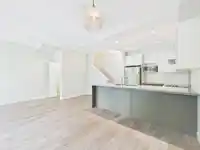
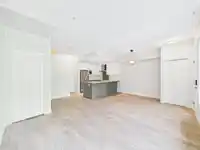
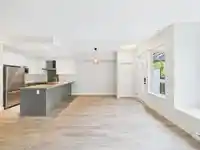
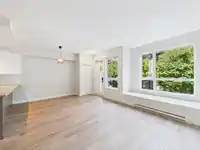
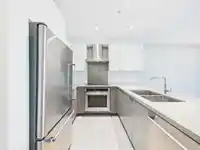
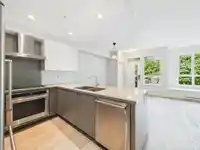
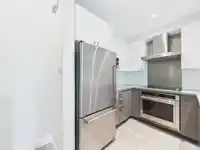
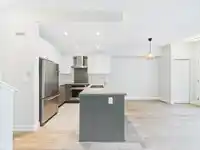
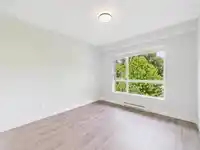
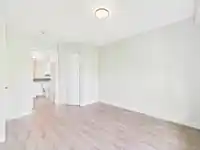
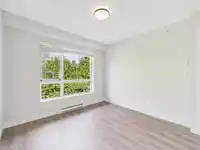
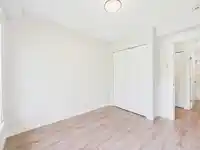
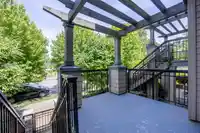
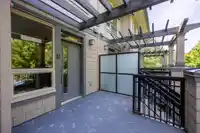
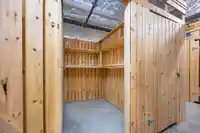
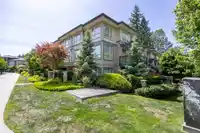
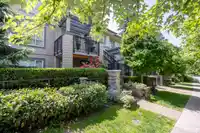
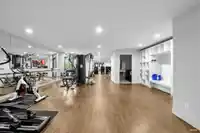
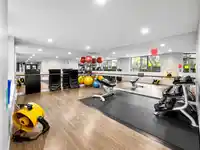
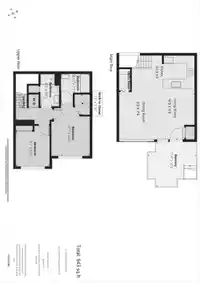
Welcome to Cameron by Ledingham McAllister in Burnaby North’s desirable Sullivan Heights. This bright 2 bed, 2 bath townhouse features 9’ ceilings, fresh interior paint, updated engineered hardwood floors, and a newly replaced bathroom door. The open living, dining, and kitchen area includes quartz countertops, stainless steel appliances, in-suite laundry,…
Features
Property Details
School Catchment
Neighbourhood
Age
- Under 1515.4%
- 15 to 6470.4%
- 65 and over14.2%
Household size
- 1 person21.7%
- 231.1%
- 320.4%
- 419.6%
- 5 or more7.2%
Language spoken at home
54.6% English mother tongue
Mother tongue, share of 4,910 residents.
How this pocket differs
- more 4-person households than Burnaby North 19.5% vs 13.2%
- fewer people living alone than Burnaby North 21.7% vs 29.8%
- notably more Tagalog speakers than Burnaby North 3% vs 1.6%
- notably fewer Cantonese speakers than Burnaby North 7.6% vs 11.7%
- more Korean speakers than Burnaby North 4.8% vs 3.7%
- Median dwelling value is lower than Metro Vancouver $750,000 vs $1,050,000
Source: Statistics Canada, Census of Population, 2021. Reproduced and distributed on an "as is" basis with the permission of Statistics Canada.
Recent nearby sales
Sold prices are available to registered users. Log in to see what these sold for.
Monthly Cost Calculator
An estimate only. Canadian semi-annual compounding; excludes utilities, closing costs and BC property transfer tax. 5-year fixed, as of Nov 16
Similar Listings Nearby
7 3211 NOEL DRIVE
3023 CENTAURUS DRIVE
8934 ORION PLACE
9110 CENTAURUS CIRCLE
8951 HORNE STREET
2982 CORONA DRIVE
8865 HORNE STREET
T1801 3970 CARRIGAN COURT
87 9088 HALSTON COURT
T6009 3980 CARRIGAN COURT
2 8745 GOVERNMENT STREET
8 9151 FOREST GROVE DRIVE