
 1 / 39 photos












About This Property
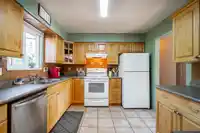
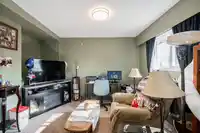
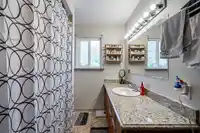
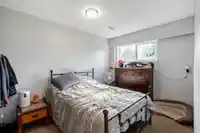
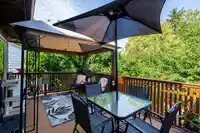
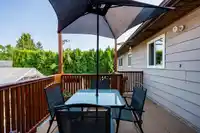
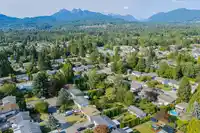
Well-maintained 2-level home on a 9,000+ sq. ft. lot, tucked away on a quiet cul-de-sac. The bright main floor features a spacious living room with a gas fireplace and granite surround, an updated kitchen with modern cabinetry and countertops, a formal dining area with access to a private deck, and a beautifully updated 4-piece bath with granite vanity. The…
Features
Property Details
School Catchment
Neighbourhood
Age
- Under 1516%
- 15 to 6468.8%
- 65 and over15.2%
Household size
- 1 person21.2%
- 232.7%
- 317.9%
- 418.3%
- 5 or more9.9%
Language spoken at home
78.8% English mother tongue
Mother tongue, share of 4,200 residents.
How this pocket differs
- fewer seniors 65+ than East Central 15.2% vs 20.6%
- notably fewer people living alone than East Central 21.2% vs 32.5%
- more 4-person households than East Central 18.3% vs 12.3%
- more 5+ person households than East Central 9.9% vs 7.5%
Source: Statistics Canada, Census of Population, 2021. Reproduced and distributed on an "as is" basis with the permission of Statistics Canada.
Land & Development
Zoning, lot dimensions and grade are approximate, from public data, and for reference only — verify with the City / Township of Langley before relying on them.
Recent nearby sales
Sold prices are available to registered users. Log in to see what these sold for.
Monthly Cost Calculator
An estimate only. Canadian semi-annual compounding; excludes utilities, closing costs and BC property transfer tax. 5-year fixed, as of Nov 19
Similar Listings Nearby
12130 GREENWELL STREET STREET
12110 GREENWELL STREET
12141 230 STREET
22938 FULLER AVENUE
11900 BURNETT STREET
23017 122A AVENUE
11895 230 STREET
12347 GREENWELL STREET
22987 123B AVENUE
12179 FLETCHER STREET
11809 230 STREET
22744 123RD AVENUE