
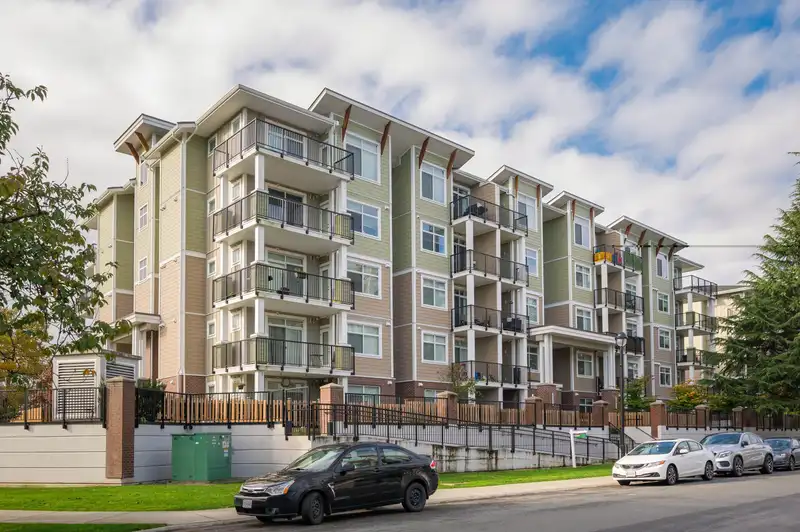
 1 / 40 photos
About This Property
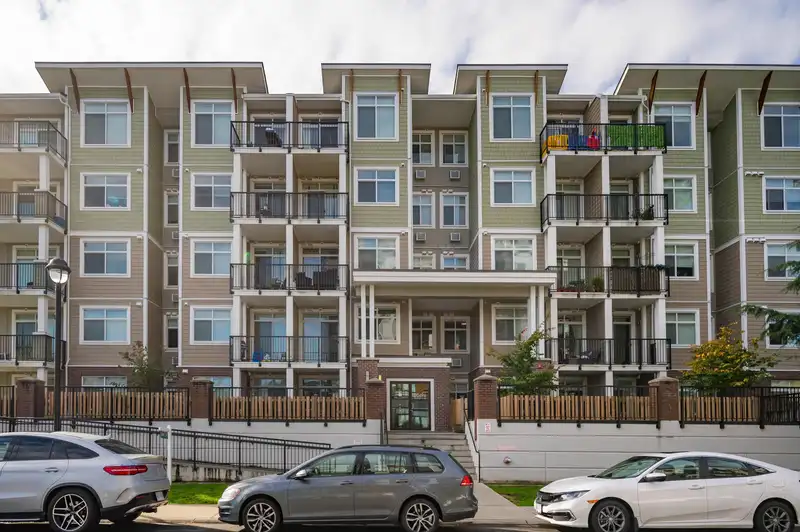
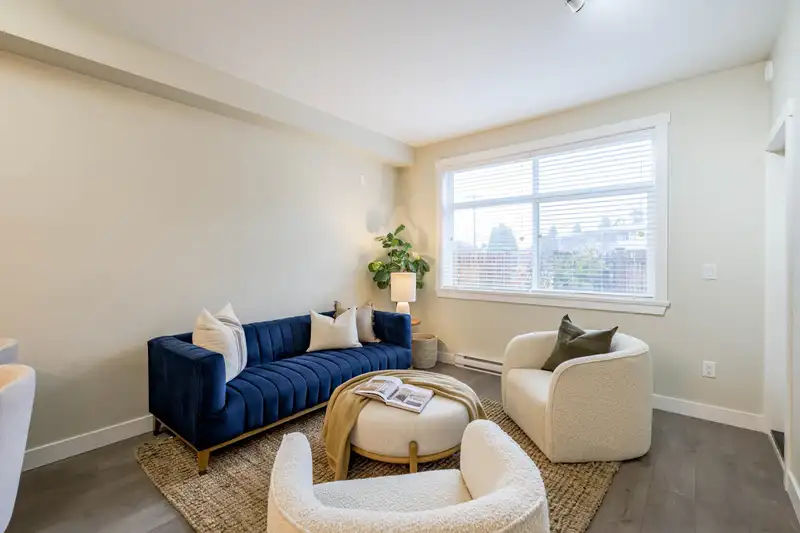
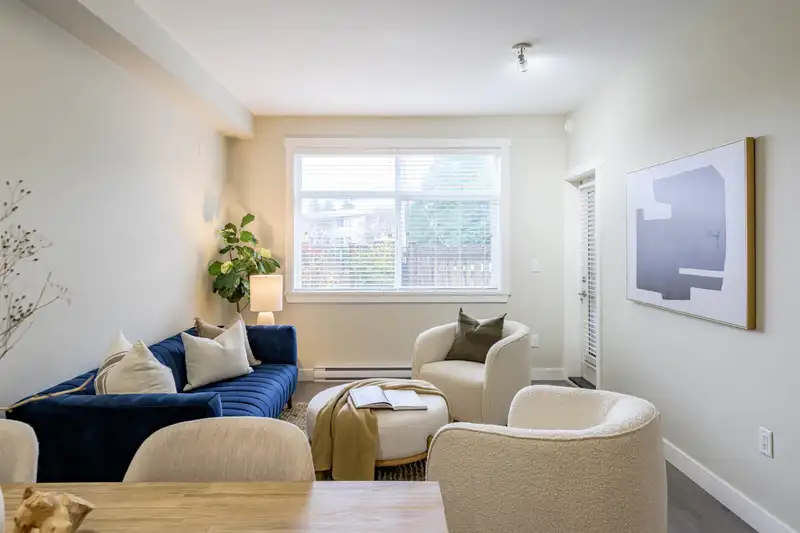
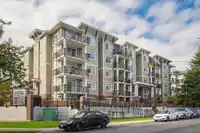
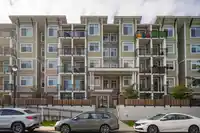
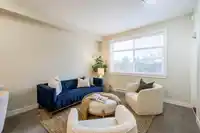
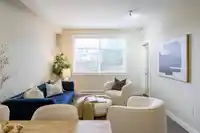
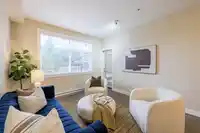
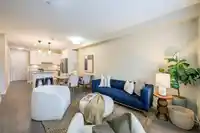
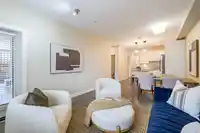
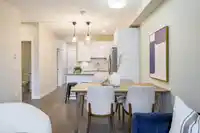
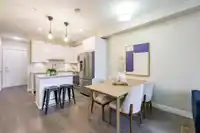
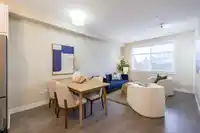
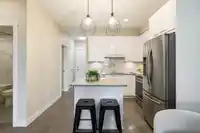
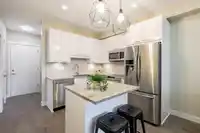
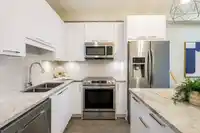
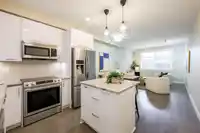
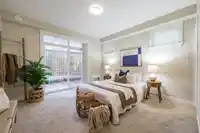
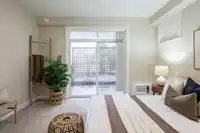
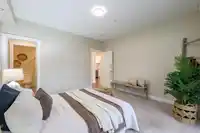
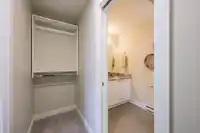
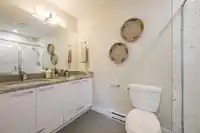
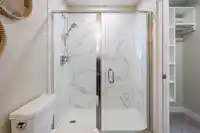
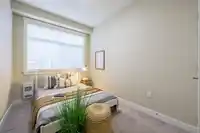
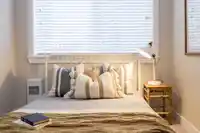
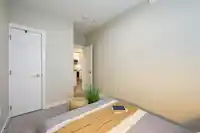
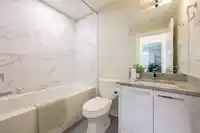
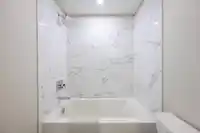
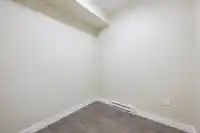
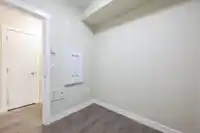
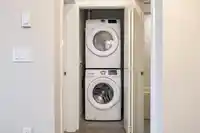
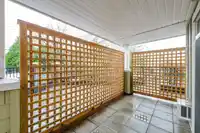
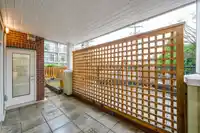
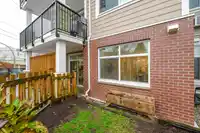
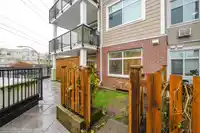
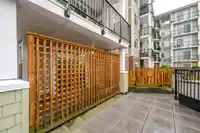
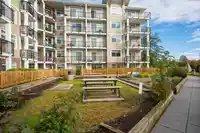
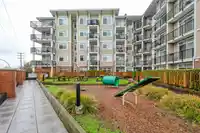
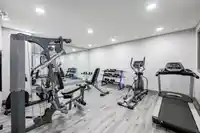
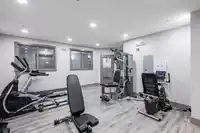
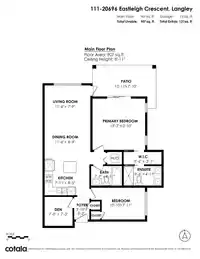
LOCATION LOCATION LOCATION! Welcome to the Georgia! South Facing Corner Ground Floor 2 Bedroom + Den, 2 Bathroom, 907 Square feet unit is centrally located and walking distance to everything city living has to offer. Step inside a warm freshly painted unit with features like white cabinetry, quartz counter tops, upgraded light fixtures, Stainless Steel…
Features
Property Details
School Catchment
Neighbourhood
Age
- Under 1516.4%
- 15 to 6461.2%
- 65 and over22.5%
Household size
- 1 person36.5%
- 237.2%
- 313.9%
- 46.6%
- 5 or more5.8%
Language spoken at home
71.6% English mother tongue
Mother tongue, share of 2,925 residents.
How this pocket differs
- notably fewer 4-person households than Langley City 6.5% vs 10.4%
- notably more Arabic speakers than Langley City 4.6% vs 1.1%
- Median household income is lower than Metro Vancouver $70,000 vs $90,000
- Median dwelling value is notably lower than Metro Vancouver $460,000 vs $1,050,000
Source: Statistics Canada, Census of Population, 2021. Reproduced and distributed on an "as is" basis with the permission of Statistics Canada.
Recent nearby sales
Sold prices are available to registered users. Log in to see what these sold for.
Monthly Cost Calculator
An estimate only. Canadian semi-annual compounding; excludes utilities, closing costs and BC property transfer tax. 5-year fixed, as of Oct 13
Similar Listings Nearby
317 20696 EASTLEIGH CRESCENT
517 20696 EASTLEIGH CRESCENT
214 20696 EASTLEIGH CRESCENT
503 20696 EASTLEIGH CRESCENT
210 20696 EASTLEIGH CRESCENT
410 20696 EASTLEIGH CRESCENT
602 20695 EASTLEIGH CRESCENT
209 20686 EASTLEIGH CRESCENT
504 20675 EASTLEIGH CRESCENT
404 20675 EASTLEIGH CRESCENT
406 20675 EASTLEIGH CRESCENT
103 20680 56 AVENUE