
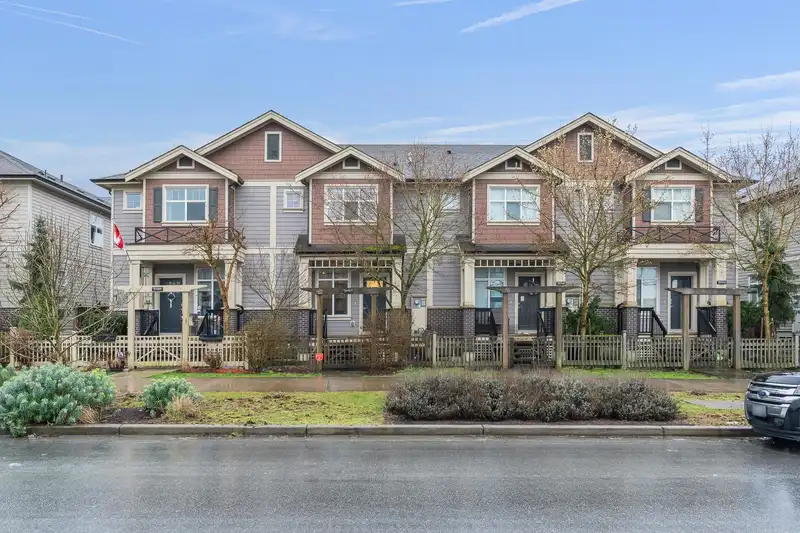
 1 / 38 photos
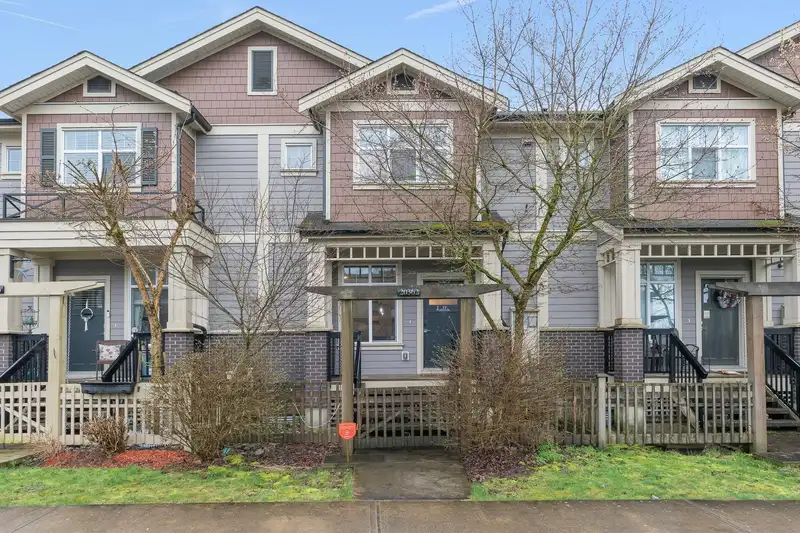
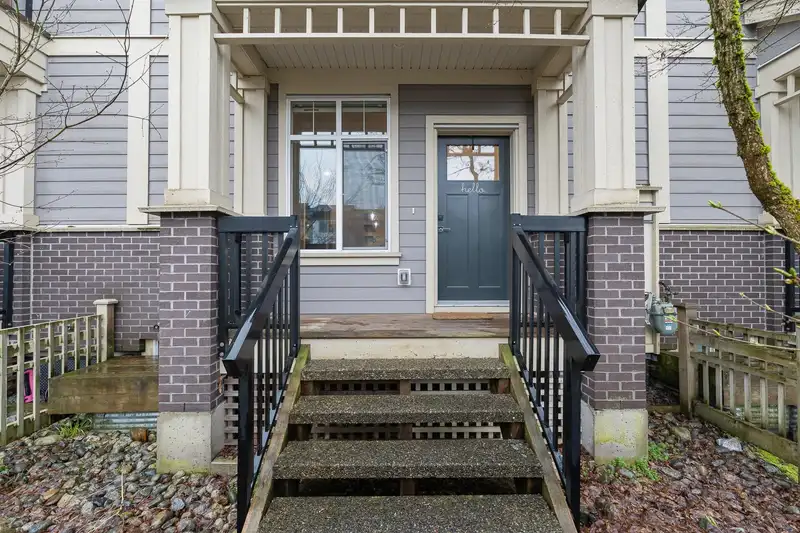




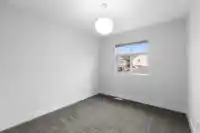
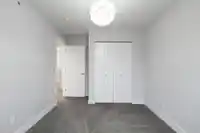
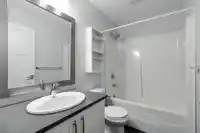




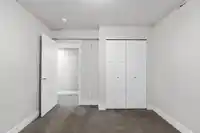

About This Property
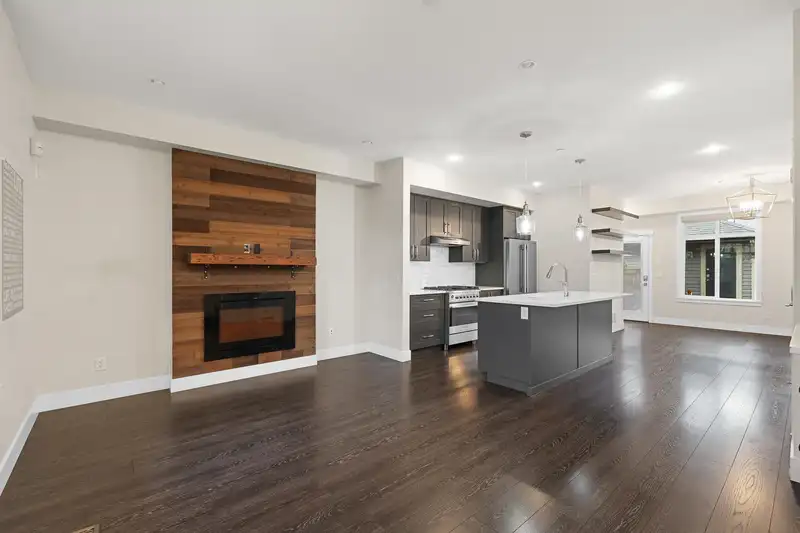
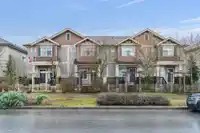
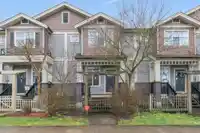
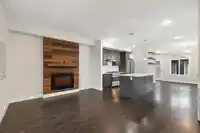
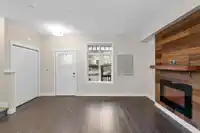
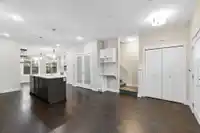
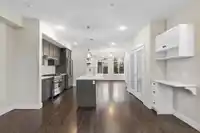
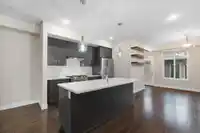
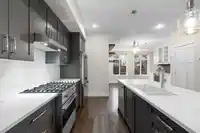
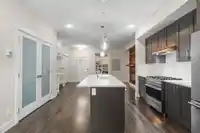
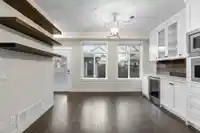
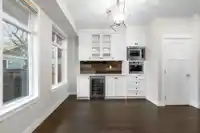
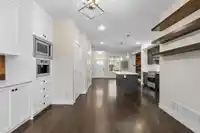
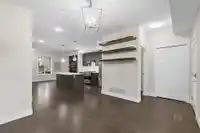
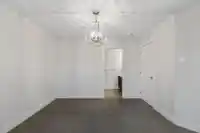
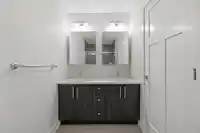
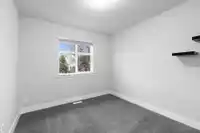
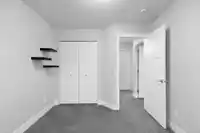
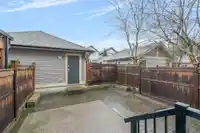
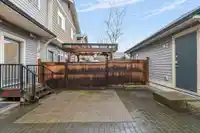
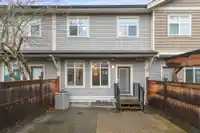
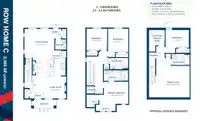
Foxridge Rowhome awaiting for a new family. Centralized A/C Installed, Farmhouse-inspired kitchen features white quartz counters, dark grey cabinetry, dual-fuel stove, high-end stainless appliances, built-in dining hutch with bar fridge & espresso station, plus a computer desk and warm laminate flooring. Walk-out fenced backyard with large patio—no grass to…
Features
Property Details
School Catchment
Neighbourhood
Age
- Under 1520.3%
- 15 to 6467.9%
- 65 and over11.9%
Household size
- 1 person21.2%
- 235%
- 320.3%
- 418%
- 5 or more5.6%
Language spoken at home
53.4% English mother tongue
Mother tongue, share of 7,755 residents.
How this pocket differs
- notably fewer 5+ person households than Willoughby Heights 5.6% vs 11.6%
- notably more Korean speakers than Willoughby Heights 18.2% vs 9.7%
- Median dwelling value is notably lower than Metro Vancouver $700,000 vs $1,050,000
Source: Statistics Canada, Census of Population, 2021. Reproduced and distributed on an "as is" basis with the permission of Statistics Canada.
Location
Recent nearby sales
Sold prices are available to registered users. Log in to see what these sold for.
Monthly Cost Calculator
Similar Listings Nearby
50 8430 203A STREET
33 8433 203A STREET
6 8433 203A STREET
43 20451 84 AVENUE
26 8433 203A STREET
13 8433 203A STREET
9 8567 204 STREET
5 8567 204 STREET
37 8371 202B STREET
60 8371 202B STREET
32 8508 204 STREET
20363 82 AVENUE