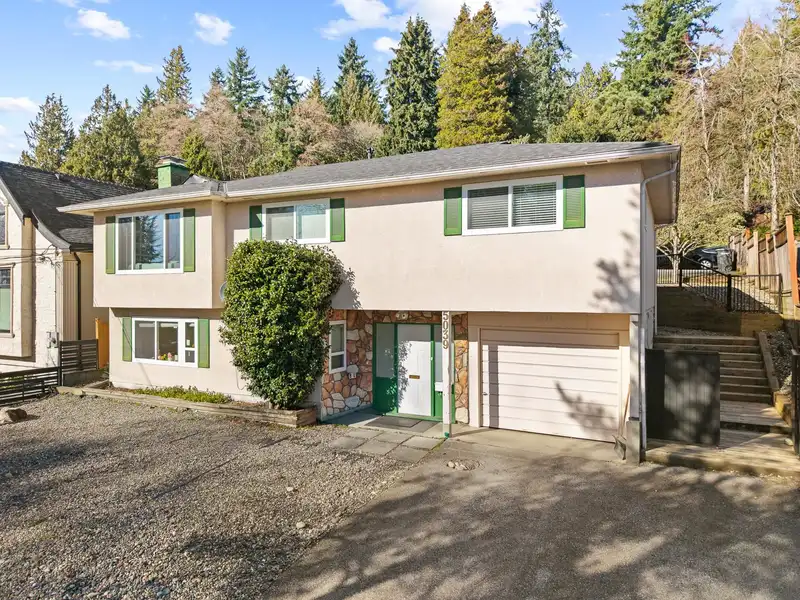
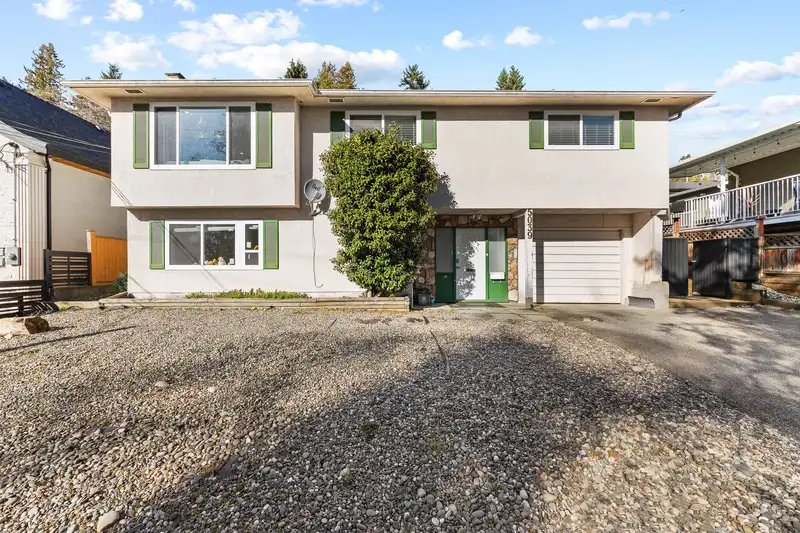
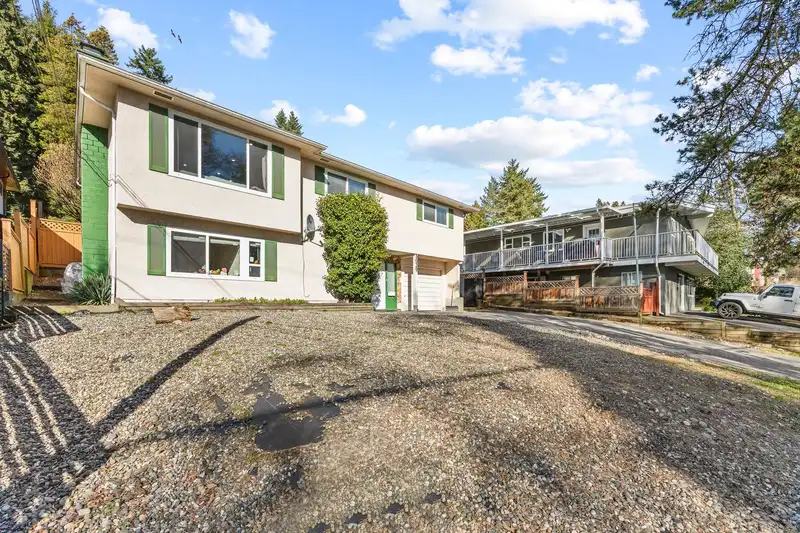
Fantastic investment opportunity—perfect to live or hold for future potential. The large lot offers a desirable south-facing view and convenient lane access. Fully renovated in 2010, featuring a new roof, furnace, hot water tank, plumbing, electrical and gas systems, windows, flooring, kitchen, bathrooms, and built-in cabinets in the living room and…
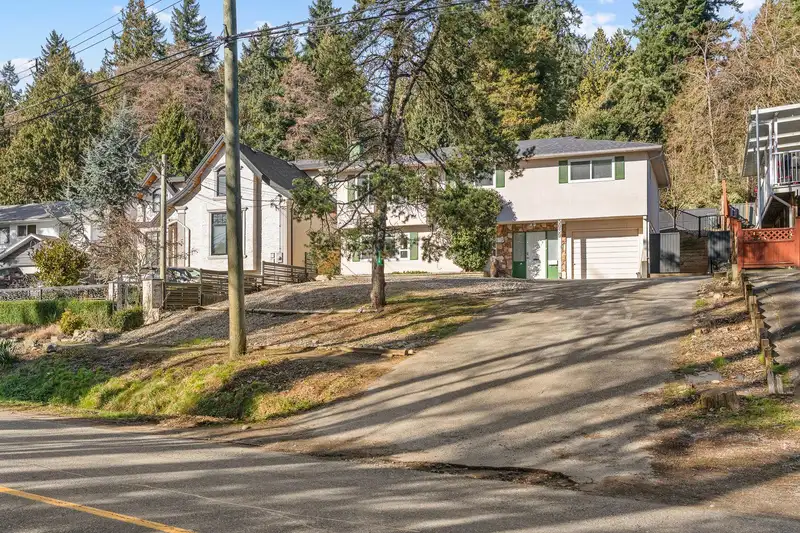
Fantastic investment opportunity—perfect to live or hold for future potential. The large lot offers a desirable south-facing view and convenient lane access. Fully renovated in 2010, featuring a new roof, furnace, hot water tank, plumbing, electrical and gas systems, windows, flooring, kitchen, bathrooms, and built-in cabinets in the living room and bedrooms. The main floor includes 3 spacious bedrooms and 2 bathrooms, offering comfortable family living. The walk-out lower level presents excellent income potential, with the possibility of creating two separate rental suites—each with 2 bedrooms and 1 bathroom. Just steps from Frogger's Creek Ravine and close to schools, shopping malls, golf courses, and community centers, this property truly has it all. Don’t miss this rare opportunity!
Features
Open
RV Access/Parking
Tandem
Front Access
Lane Access
Room measurements13 rooms▸
Living RoomMain · 12' × 14'
KitchenMain · 9' × 10'
Dining RoomMain · 8' × 9'
Primary BedroomMain · 11' × 12'
BedroomMain · 10' × 11'
BedroomMain · 9' × 10'
Living RoomBelow · 12'9 × 13'8
Dining RoomBelow · 11'6 × 11'11
Bar RoomBelow · 4'8 × 7'11
BedroomBelow · 7'11 × 11'1
BedroomBelow · 7'11 × 12'9
BedroomBelow · 9'11 × 10'3
BedroomBelow · 9'11 × 9'11
Floor plan
🔍 Tap to zoom
Pinch or scroll to zoom · drag to pan · double-tap to reset
Property Details
MLS NumberR3095159
Property TypeSingle Family Residence
Bedrooms7
Bathrooms3.5
Square Feet2,276
Lot Size7,936 sqft
Year Built1968
HeatingForced Air, Natural Gas
Days on Market261
StatusActive
Listed ByLeHomes Realty Premier
School Catchment
ElementaryNelson
SecondaryBurnaby South
Neighbourhood
Highlighted area = this home's census tract (StatCan), the boundary the neighbourhood stats describe.
$1,640,000Median home value
$102,000Median household income
75.6%Owner-occupied
46.2%Single-detached homes
2.9Avg household size
42.4Median age
47.1%Bachelor's degree or higher (25-64)
51.1%Commute under 30 min
75.2%Drive to work
51.3%Foreign-born residents
3,767Neighbourhood population
Age
Under 1512.9%
15 to 6468.3%
65 and over18.8%
Household size
1 person19%
232.3%
317.1%
417.9%
5 or more13.7%
Language spoken at home
41.6% English mother tongue
Mandarin16.2%
Cantonese11.6%
English + other4.7%
Punjabi4.5%
Tagalog2.7%
Korean1.6%
All others17.1%
Mother tongue, share of 3,760 residents.
How this pocket differs
notably more 5+ person households than Burnaby South 13.7% vs 7.7%
notably fewer people living alone than Burnaby South 19% vs 30.4%
more 4-person households than Burnaby South 17.9% vs 12.3%
notably more Punjabi speakers than Burnaby South 4.5% vs 2.3%
Median dwelling value is notably higher than Metro Vancouver $1,640,000 vs $1,050,000
Source: Statistics Canada, Census of Population, 2021. Reproduced and distributed on an "as is" basis with the permission of Statistics Canada.
Land & Development
Lot size7,691 sqft
Lot dimensions61 × 144 ft
Lot shapeSlightly irregular
Approximate lot lines (ParcelMap BC)
Zoning, lot dimensions and grade are approximate, from public data, and for reference only — verify with the City / Township of Langley before relying on them.
Recent nearby sales
Sold prices are available to registered users. Log in to see what these sold for.

 1 / 40 photos