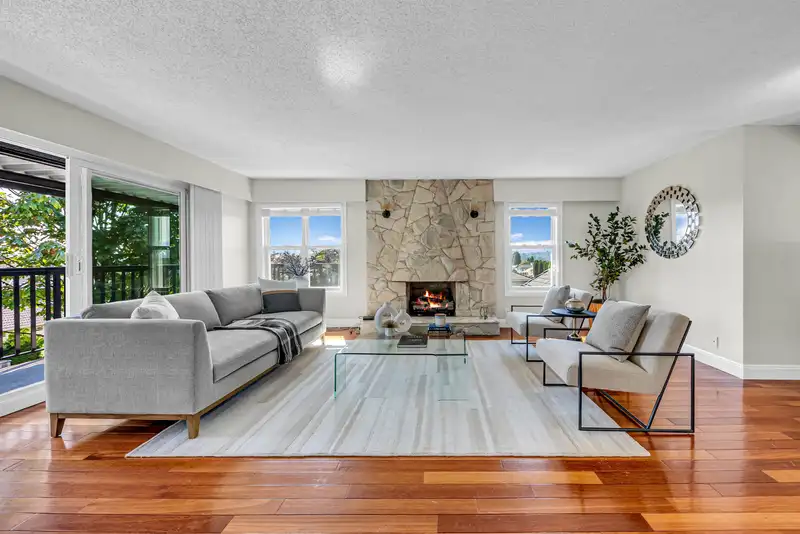
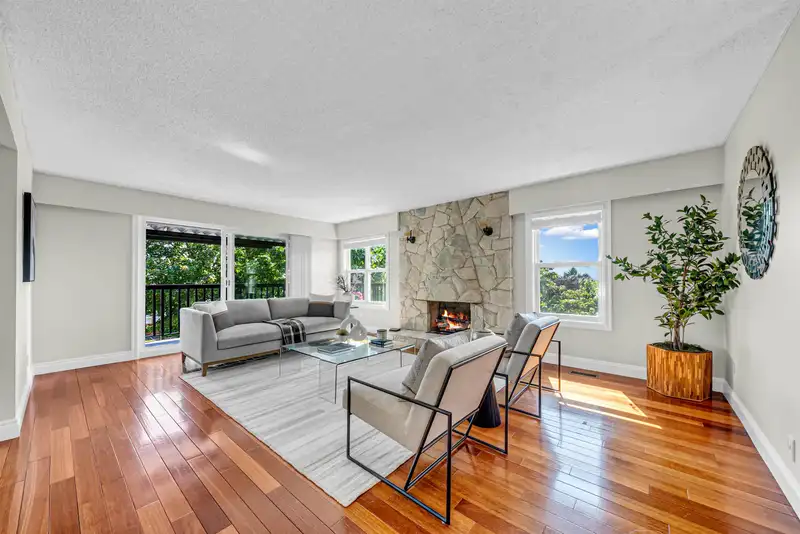
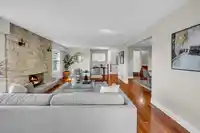
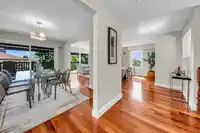
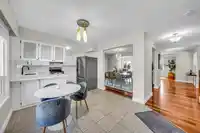
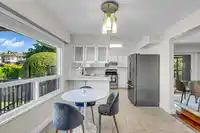
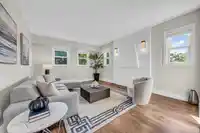
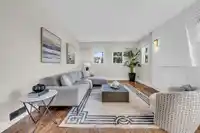
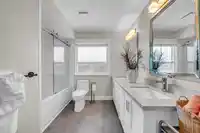
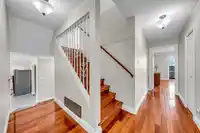
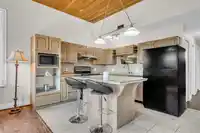
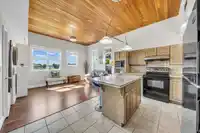
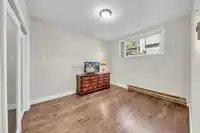
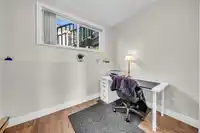
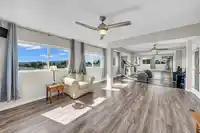
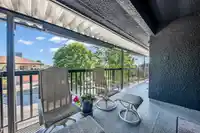
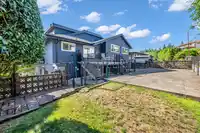
Welcome to this beautifully updated family home on a quiet cul-de-sac in one of North Burnaby's most sought-after neighborhoods. Situated on a 7,187 sq. ft. corner lot, this spacious home offers over 3,800 sq. ft. of living space with 5 bedrooms, 4 bathrooms, formal living and dining rooms, a bright sunroom, a large family room, and a top-floor flex space…
Welcome to this beautifully updated family home on a quiet cul-de-sac in one of North Burnaby's most sought-after neighborhoods. Situated on a 7,187 sq. ft. corner lot, this spacious home offers over 3,800 sq. ft. of living space with 5 bedrooms, 4 bathrooms, formal living and dining rooms, a bright sunroom, a large family room, and a top-floor flex space with panoramic Vancouver views. The self-contained 2-bedroom suite is ideal for extended family or potential rental income. Meticulously maintained with over $220,000 in upgrades, including a gourmet kitchen, renovated ensuite, windows, roof, furnace, tankless hot water, air conditioner, and new decks. Located in the highly desirable Westridge Elementary and Burnaby North Secondary catchments, just minutes to SFU, parks and shops.
Features
Pantry
Balcony
Private Yard
Garage Double
Side Access
Concrete
Garage Door Opener
Shopping Nearby
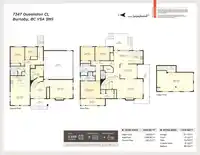
Room measurements16 rooms▸
FoyerMain · 12'7 × 12'1
Living RoomMain · 13'2 × 16'2
KitchenMain · 10'0 × 14'9
BedroomMain · 14'0 × 10'3
BedroomMain · 9'2 × 9'3
Living RoomMain · 12'3 × 14'9
LaundryMain · 8'9 × 9'7
Family RoomAbove · 13'2 × 16'2
Dining RoomAbove · 10'10 × 12'10
KitchenAbove · 9'9 × 10'7
NookAbove · 9'9 × 11'7
Primary BedroomAbove · 13'1 × 14'11
Walk-In ClosetAbove · 3'7 × 9'11
BedroomAbove · 10'4 × 10'7
BedroomAbove · 10'4 × 11'2
Recreation RoomAbv Main 2 · 15'6 × 27'5
Floor plan
🔍 Tap to zoom
Pinch or scroll to zoom · drag to pan · double-tap to reset
Property Details
MLS NumberR3147963
Property TypeSingle Family Residence
Bedrooms5
Bathrooms3.5
Square Feet3,849
Lot Size7,187 sqft
Year Built1978
Parking Spaces2
HeatingForced Air
Days on Market27
StatusActive
Listed BySutton Group - 1st West Realty
School Catchment
ElementaryEcole Westridge
SecondaryBurnaby North
Neighbourhood
Highlighted area = this home's census tract (StatCan), the boundary the neighbourhood stats describe.
$1,600,000Median home value
$94,000Median household income
63.1%Owner-occupied
37.6%Single-detached homes
2.7Avg household size
43.2Median age
43.5%Bachelor's degree or higher (25-64)
48.2%Commute under 30 min
77.1%Drive to work
45.5%Foreign-born residents
6,159Neighbourhood population
Age
Under 1512.8%
15 to 6467.4%
65 and over19.8%
Household size
1 person21.6%
230.1%
320.3%
417.8%
5 or more10.2%
Language spoken at home
43.4% English mother tongue
Cantonese13.9%
Mandarin13.5%
Italian4.5%
English + other4.3%
Korean1.9%
Spanish1.9%
All others16.6%
Mother tongue, share of 6,115 residents.
How this pocket differs
more 5+ person households than Burnaby North 10.2% vs 7.1%
fewer people living alone than Burnaby North 21.6% vs 29.8%
more 4-person households than Burnaby North 17.8% vs 13.2%
notably more Italian speakers than Burnaby North 4.5% vs 2.5%
notably more Mandarin speakers than Burnaby North 13.5% vs 8.7%
Median dwelling value is notably higher than Metro Vancouver $1,600,000 vs $1,050,000
Source: Statistics Canada, Census of Population, 2021. Reproduced and distributed on an "as is" basis with the permission of Statistics Canada.
Land & Development
Lot size7,190 sqft
Lot dimensions56 × 99 ft
Lot shapeIrregular
Approximate lot lines (ParcelMap BC)
Zoning, lot dimensions and grade are approximate, from public data, and for reference only — verify with the City / Township of Langley before relying on them.
Recent nearby sales
Sold prices are available to registered users. Log in to see what these sold for.

 1 / 40 photos